
Page 108 -
P. 108
Chapter 4
Sales and Operations Planning in SAP ERP
In SAP ERP, the sales forecast can incorporate historical sales data from the Sales and
Distribution (SD) module, or the forecast can be created using input from plans developed
in the Controlling (CO) module. In the CO module, profit goals for the company can be
88 set, which can then be used to estimate the sales levels needed to meet the profit goals.
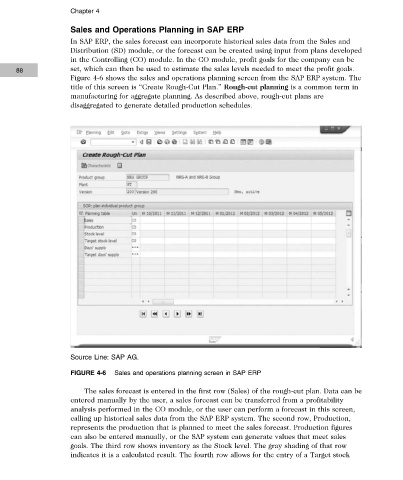
Figure 4-6 shows the sales and operations planning screen from the SAP ERP system. The
title of this screen is “Create Rough-Cut Plan.” Rough-cut planning is a common term in
manufacturing for aggregate planning. As described above, rough-cut plans are
disaggregated to generate detailed production schedules.
Source Line: SAP AG.
FIGURE 4-6 Sales and operations planning screen in SAP ERP
The sales forecast is entered in the first row (Sales) of the rough-cut plan. Data can be
entered manually by the user, a sales forecast can be transferred from a profitability
analysis performed in the CO module, or the user can perform a forecast in this screen,
calling up historical sales data from the SAP ERP system. The second row, Production,
represents the production that is planned to meet the sales forecast. Production figures
can also be entered manually, or the SAP system can generate values that meet sales
goals. The third row shows inventory as the Stock level. The gray shading of that row
indicates it is a calculated result. The fourth row allows for the entry of a Target stock
Copyright 2012 Cengage Learning. All Rights Reserved. May not be copied, scanned, or duplicated, in whole or in part. Due to electronic rights, some third party content may be suppressed from the eBook and/or eChapter(s).
Editorial review has deemed that any suppressed content does not materially affect the overall learning experience. Cengage Learning reserves the right to remove additional content at any time if subsequent rights restrictions require it.