
Page 108 - Control Theory in Biomedical Engineering
P. 108
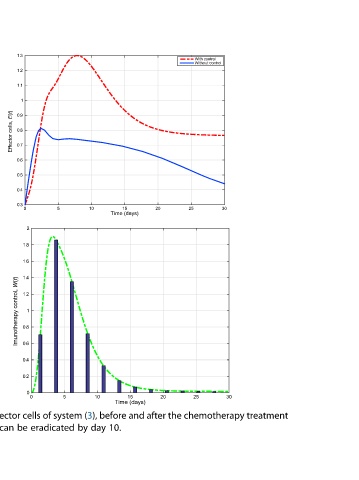
treatment


                                                                         30
                                       30
            With control  Without control                                   the chemotherapy

                                       25                                25

                                                                         20
                                       20                                   and after
                                        Time (days)                      15  Time (days)
                                       15                                     10.

                                                                         10  (3), before  day
                                       10                                     by
                                                                            of system
                                                                         5
                                       5                                      eradicated
                                                                            the tumor cells and effector cells  population
                                                                         0
                                          2              1              0
                                       0     1.8  1.6  1.4  1.2  0.8  0.6  0.4  0.2
           1.3  1.2  1.1  1  0.9  0.8  0.7  Effector cells, E(t)  0.6  0.5  0.4  0.3  Imunotherapy control, W(t)  be  can
                                      30                                30
            Without control
            With control
                                      25                                25


                                      20                                20    cells’  tumor


                                      15  Time (days)                   15  Time (days)  populations of  the

                                      10                                10    that  shows


                                      5                                 5     It  w(t).


                                      0                                 0   Numerical simulations of  and
           300  250  200  150  Tumour cells, T(t)  100  50  0  0.9  0.8  0.7  0.6  0.5  0.4  0.3  Chemotherapy control, V(t)  0.2  0.1  0  v(t)


                                                                            Fig. 2  controls  with