
Page 88 - Control Theory in Biomedical Engineering
P. 88
Statistics
>180 Max Min SD Mean >250 247 85 35.8 153.8 0.0 26.0 261 80 39.2 151.6 0.7 26.2 236 103 35.7 146.6 0.0 23.0 259 80 36.0 143.3 0.2 18.3 262 74 37.5 140.3 0.6 18.0 232 93 31.5 149.3 0.0 20.2 237 92 33.0 141.9 0.0 17.4 238 91 34.9 141.9 0.0 19.5 268 89 42.1 162.0 3.0
days. range in
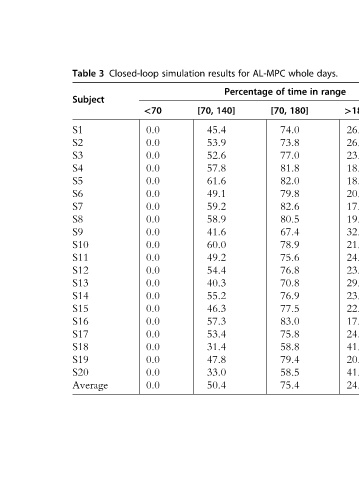
whole time 180] 74.0 73.8 77.0 81.8 82.0 79.8 82.6 80.5 67.4 78.9 75.6 76.8 70.8 76.9 77.5 83.0 75.8 58.8 79.4 58.5 75.4
AL-MPC of [70,
for Percentage
results 140] [70, 45.4 53.9 52.6 57.8 61.6 49.1 59.2 58.9 41.6 60.0 49.2 54.4 40.3 55.2 46.3 57.3 53.4 31.4 47.8 33.0 50.4
simulation
Closed-loop <70 0.0 0.0 0.0 0.0 0.0 0.0 0.0 0.0 0.0 0.0 0.0 0.0 0.0 0.0 0.0 0.0 0.0 0.0 0.0 0.0 0.0
3
Table Subject S1 S2 S3 S4 S5 S6 S7 S8 S9 S10 S11 S12 S13 S14 S15 S16 S17 S18 S19 S20 Average