
Page 188 - Corrosion Engineering Principles and Practice
P. 188
162 C h a p t e r 6 R e c o g n i z i n g t h e F o r m s o f C o r r o s i o n 163
The concept of using probabilistic statistics to describe corrosion
processes was first applied in the 1930s [8;9]. In their landmark paper,
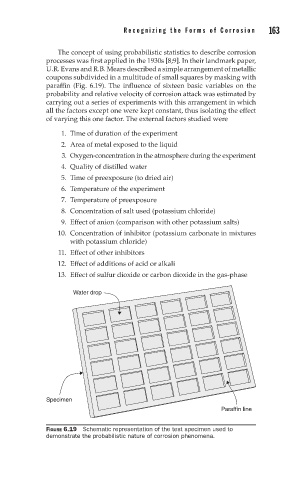
U.R. Evans and R.B. Mears described a simple arrangement of metallic
coupons subdivided in a multitude of small squares by masking with
paraffin (Fig. 6.19). The influence of sixteen basic variables on the
probability and relative velocity of corrosion attack was estimated by
carrying out a series of experiments with this arrangement in which
all the factors except one were kept constant, thus isolating the effect
of varying this one factor. The external factors studied were
1. Time of duration of the experiment
2. Area of metal exposed to the liquid
3. Oxygen-concentration in the atmosphere during the experiment
4. Quality of distilled water
5. Time of preexposure (to dried air)
6. Temperature of the experiment
7. Temperature of preexposure
8. Concentration of salt used (potassium chloride)
9. Effect of anion (comparison with other potassium salts)
10. Concentration of inhibitor (potassium carbonate in mixtures
with potassium chloride)
11. Effect of other inhibitors
12. Effect of additions of acid or alkali
13. Effect of sulfur dioxide or carbon dioxide in the gas-phase
Water drop
Specimen
Paraffin line
FIGURE 6.19 Schematic representation of the test specimen used to
demonstrate the probabilistic nature of corrosion phenomena.