
Page 290 - Corrosion Engineering Principles and Practice
P. 290
264 C h a p t e r 8 C o r r o s i o n b y W a t e r 265
corrode through a pipe wall was found to be directly proportional to
the square of the wall thickness, for example, for a wall thickness
reduction of 50 percent the corrosion life will be reduced to 25 percent
of the life of the original pipe thickness.
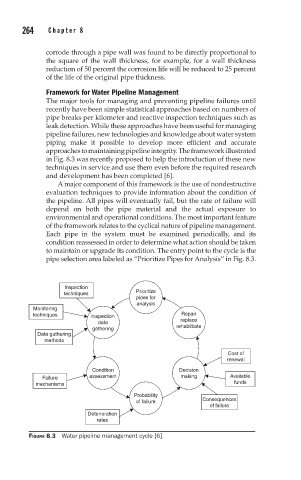
Framework for Water Pipeline Management
The major tools for managing and preventing pipeline failures until
recently have been simple statistical approaches based on numbers of
pipe breaks per kilometer and reactive inspection techniques such as
leak detection. While these approaches have been useful for managing
pipeline failures, new technologies and knowledge about water system
piping make it possible to develop more efficient and accurate
approaches to maintaining pipeline integrity. The framework illustrated
in Fig. 8.3 was recently proposed to help the introduction of these new
techniques in service and use them even before the required research
and development has been completed [6].
A major component of this framework is the use of nondestructive
evaluation techniques to provide information about the condition of
the pipeline. All pipes will eventually fail, but the rate of failure will
depend on both the pipe material and the actual exposure to
environmental and operational conditions. The most important feature
of the framework relates to the cyclical nature of pipeline management.
Each pipe in the system must be examined periodically, and its
condition reassessed in order to determine what action should be taken
to maintain or upgrade its condition. The entry point to the cycle is the
pipe selection area labeled as “Prioritize Pipes for Analysis” in Fig. 8.3.
Inspection
techniques Prioritize
pipes for
analysis
Monitoring
techniques Inspection Repair
data replace
gathering rehabilitate
Data gathering
methods
Cost of
renewal
Condition Decision
Failure assessment making Available
mechanisms funds
Probability
of failure Consequences
of failure
Deterioration
rates
FIGURE 8.3 Water pipeline management cycle [6].