
Page 127 - Culture Technology Communication
P. 127
110 Carleen F. Maitland and Johannes M. Bauer
higher teledensity, higher school enrollment). By using this sub-sam-
ple it may be possible to control for the influences of these variables.
Of these forty-eight countries some adopted the Internet earlier
than others. To reflect this aspect of growth a measure was devised
that took the percent adoption achieved by 1997 and multiplied it by
the reverse-coded START variable. Therefore, countries achieving
higher adoption percentages in fewer number of years will have a
higher growth score. The growth measure also controls for country
size as the percentage adoption figure is based on the number of
phone lines which partially reflects a country’s size. 17
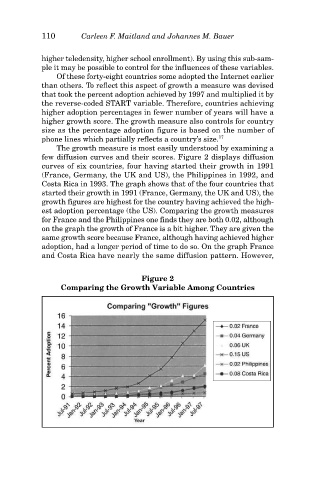
The growth measure is most easily understood by examining a
few diffusion curves and their scores. Figure 2 displays diffusion
curves of six countries, four having started their growth in 1991
(France, Germany, the UK and US), the Philippines in 1992, and
Costa Rica in 1993. The graph shows that of the four countries that
started their growth in 1991 (France, Germany, the UK and US), the
growth figures are highest for the country having achieved the high-
est adoption percentage (the US). Comparing the growth measures
for France and the Philippines one finds they are both 0.02, although
on the graph the growth of France is a bit higher. They are given the
same growth score because France, although having achieved higher
adoption, had a longer period of time to do so. On the graph France
and Costa Rica have nearly the same diffusion pattern. However,
Figure 2
Comparing the Growth Variable Among Countries