
Page 123 - Culture Technology Communication
P. 123
106 Carleen F. Maitland and Johannes M. Bauer
Appendix A. For both analyses the explanatory power of the inde-
pendent variables was tested using stepwise regression with the most
highly correlated variable with the dependent variable being entered
first. Variables added to the model were entered only if their intercor-
relation was 0.6 or less. Using these selection criteria for additional
variables, stepwise regression then makes clear the amount of vari-
ance attributed to each new variable in the model.
METHOD 1
For the full sample the most highly correlated variables with the de-
pendent variable START in order are Newspapers per one hundred,
GDP per capita, Teledensity, Gender Empowerment, International
Call Cost, School Enrollment, PCs per one thousand, English Lan-
guage Ability, Links, and Centrality. Exploring the correlation ma-
trix, seven unique models were found.
The model with the strongest explanatory power includes the
variables Teledensity, International Call Cost, and English Lan-
2
14
guage Ability (TOEFL). In addition to having the largest R (.614) ,
the model was tested on the largest number of countries (122). The
results, particularly regarding the strong explanatory power of tele-
density, were expected. Unfortunately, it was impossible to combine
teledensity with other variables due to the high intercorrelations.
GDP per capita also suffered the same fate. The result of these high
intercorrelations is that the variables’ power can be compared with
only a few other variables.
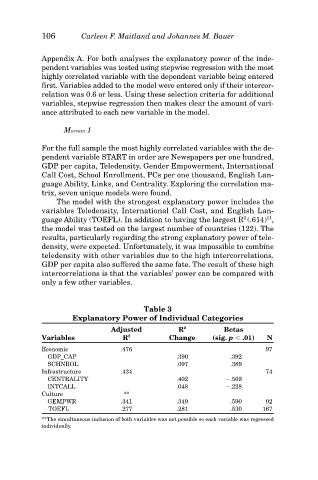
Table 3
Explanatory Power of Individual Categories
Adjusted R 2 Betas
Variables R 2 Change (sig. p .01) N
Economic .476 97
GDP_CAP .390 .392
SCHNROL .097 .389
Infrastructure .434 74
CENTRALITY .402 .569
INTCALL .048 .228
Culture **
GEMPWR .341 .349 .590 92
TOEFL .277 .281 .530 167
**The simultaneous inclusion of both variables was not possible so each variable was regressed
individually.