Page 125 - Culture Technology Communication
P. 125

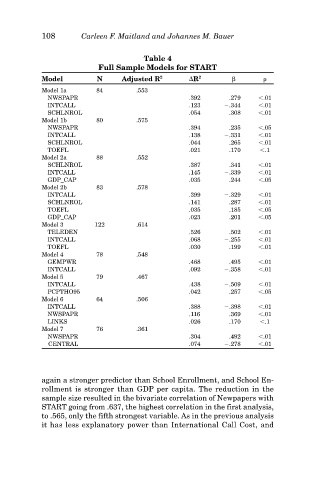
108        Carleen F. Maitland and Johannes M. Bauer


                                        Table 4
                           Full Sample Models for START
            Model          N      Adjusted R 2       R 2
            Model 1a       84         .553
              NWSPAPR                               .392       .279    .01
              INTCALL                               .123      .344     .01
              SCHLNROL                              .054       .308    .01
            Model 1b       80         .575
              NWSPAPR                               .394       .235    .05
              INTCALL                               .138      .331     .01
              SCHLNROL                              .044       .265    .01
              TOEFL                                 .021       .170     .1
            Model 2a       88         .552
              SCHLNROL                              .387       .341    .01
              INTCALL                               .145      .339     .01
              GDP_CAP                               .035       .244    .05
            Model 2b       83         .578
              INTCALL                               .399      .329     .01
              SCHLNROL                              .141       .287    .01
              TOEFL                                 .035       .185    .05
              GDP_CAP                               .023       .201    .05
            Model 3        122        .614
              TELEDEN                               .526       .502    .01
              INTCALL                               .068      .255     .01
              TOEFL                                 .030       .199    .01
            Model 4        78         .548
              GEMPWR                                .468       .495    .01
              INTCALL                               .092      .358     .01
            Model 5        79         .467
              INTCALL                               .438      .509     .01
              PCPTHO95                              .042       .257    .05
            Model 6        64         .506
              INTCALL                               .388      .398     .01
              NWSPAPR                               .116       .369    .01
              LINKS                                 .026       .170     .1
            Model 7        76         .361
              NWSPAPR                               .304       .492    .01
              CENTRAL                               .074      .278     .01


            again a stronger predictor than School Enrollment, and School En-
            rollment is stronger than GDP per capita. The reduction in the
            sample size resulted in the bivariate correlation of Newpapers with
            START going from .637, the highest correlation in the first analysis,
            to .565, only the fifth strongest variable. As in the previous analysis
            it has less explanatory power than International Call Cost, and
   120   121   122   123   124   125   126   127   128   129   130