
Page 128 - Culture Technology Communication
P. 128
National Level Culture and Global Diffusion 111
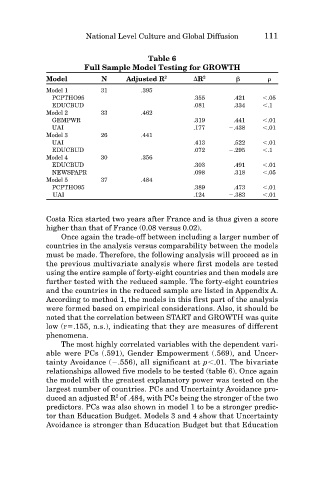
Table 6
Full Sample Model Testing for GROWTH
Model N Adjusted R 2 R 2
Model 1 31 .395
PCPTHO95 .355 .421 .05
EDUCBUD .081 .334 .1
Model 2 33 .462
GEMPWR .319 .441 .01
UAI .177 .438 .01
Model 3 26 .441
UAI .413 .522 .01
EDUCBUD .072 .295 .1
Model 4 30 .356
EDUCBUD .303 .491 .01
NEWSPAPR .098 .318 .05
Model 5 37 .484
PCPTHO95 .389 .473 .01
UAI .124 .383 .01
Costa Rica started two years after France and is thus given a score
higher than that of France (0.08 versus 0.02).
Once again the trade-off between including a larger number of
countries in the analysis versus comparability between the models
must be made. Therefore, the following analysis will proceed as in
the previous multivariate analysis where first models are tested
using the entire sample of forty-eight countries and then models are
further tested with the reduced sample. The forty-eight countries
and the countries in the reduced sample are listed in Appendix A.
According to method 1, the models in this first part of the analysis
were formed based on empirical considerations. Also, it should be
noted that the correlation between START and GROWTH was quite
low (r .155, n.s.), indicating that they are measures of different
phenomena.
The most highly correlated variables with the dependent vari-
able were PCs (.591), Gender Empowerment (.569), and Uncer-
tainty Avoidance ( .556), all significant at p .01. The bivariate
relationships allowed five models to be tested (table 6). Once again
the model with the greatest explanatory power was tested on the
largest number of countries. PCs and Uncertainty Avoidance pro-
2
duced an adjusted R of .484, with PCs being the stronger of the two
predictors. PCs was also shown in model 1 to be a stronger predic-
tor than Education Budget. Models 3 and 4 show that Uncertainty
Avoidance is stronger than Education Budget but that Education