
Page 139 - Culture Technology Communication
P. 139
GDP_CAP 1.00 .067 .412 .051 .155 .182 .451** .438** .270*
r with .761** .598** .891** .885** .353** .847** .167* .536** .914** .632** .327**
Partial R with START CONTROL .184* .221 .194 .312** .318** .167 .015 .099 .282** .675** .186 .457** .436** .226* .197* .842** .320** .009 .442**
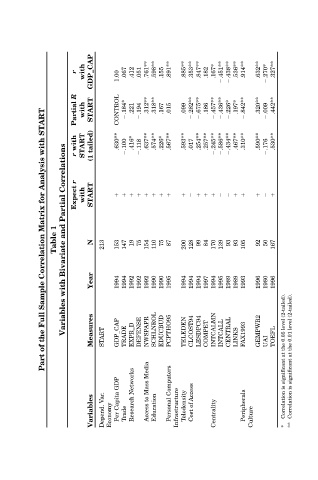
Part of the Full Sample Correlation Matrix for Analysis with START
with START (1 tailed) .630** .100 .416* .118 .637** .574** .226* .567** .593** .017 .254** .257** .245** .586** .434** .467** .310** .590** .176 .530**
r
r
Expect with START
Table 1 Variables with Bivariate and Partial Correlations N 213 153 147 19 75 154 110 75 87 200 128 99 84 170 139 93 93 105 92 50 167
Year 1994 1994 1992 1992 1992 1990 1990 1995 1994 1994 1994 1997 1994 1995 1989 1989 1993 1996 1980 1996
Measures START GDP_CAP TRADE EXPR_D DEFENSE NWSPAPR SCHLNROL EDUCBUD PCPTHO95 TELEDEN CLCOST94 LESDPC94 COMPET INTCALMN INTCALL CENTRAL LINKS FAX1993 GEMPWR2 UAI TOEFL Correlation is significant at the 0.05 level (2-tailed). Correlation is significant at the 0.01 level (2-tailed).
Variables Depend. Var. Economy Per Capita GDP Trade Research Networks Access to Mass Media Education Personal Computers Infrastructure Teledensity Cost of Access Centrality Peripherals Culture * **