
Page 143 - Culture Technology Communication
P. 143
126 Carleen F. Maitland and Johannes M. Bauer
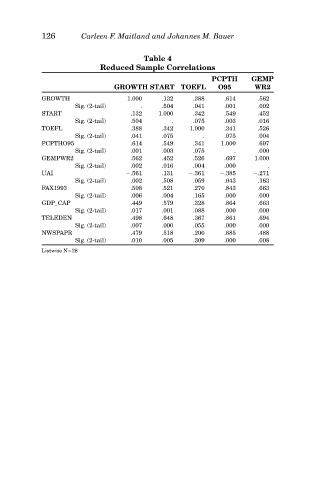
Table 4
Reduced Sample Correlations
PCPTH GEMP
GROWTH START TOEFL O95 WR2
GROWTH 1.000 .132 .388 .614 .562
Sig. (2-tail) . .504 .041 .001 .002
START .132 1.000 .342 .549 .452
Sig. (2-tail) .504 . .075 .003 .016
TOEFL .388 .342 1.000 .341 .526
Sig. (2-tail) .041 .075 . .075 .004
PCPTHO95 .614 .549 .341 1.000 .697
Sig. (2-tail) .001 .003 .075 . .000
GEMPWR2 .562 .452 .526 .697 1.000
Sig. (2-tail) .002 .016 .004 .000 .
UAI .561 .131 .361 .385 .271
Sig. (2-tail) .002 .508 .059 .043 .163
FAX1993 .508 .521 .270 .843 .663
Sig. (2-tail) .006 .004 .165 .000 .000
GDP_CAP .449 .579 .328 .864 .663
Sig. (2-tail) .017 .001 .088 .000 .000
TELEDEN .498 .648 .367 .861 .694
Sig. (2-tail) .007 .000 .055 .000 .000
NWSPAPR .479 .518 .200 .685 .488
Sig. (2-tail) .010 .005 .309 .000 .008
Listwise N 28