
Page 111 -
P. 111
90 CHAPTER 8 Vision
Activity Summary Table
Objective Produce a visual represen tation of the DG vision.
Purpose Develop the deliverable that will serve to convey the
value and purpose of the DG program.
Inputs DG requirements, mission and vision statements, and
elevator speech
Tasks 1. Identify single-page abstract of DG vision.
2. Identify notional DG touchpoints.
3. Develop "day-in-the-life" picture.
Techniques
Tools Word, PowerPoint, and similar programs
Outputs 1. Visual DG vision
2. Refined DG business value proposition
3. “Day-in-the-life” slide
FIGURE 8-6
Activity Summary Table.
Business Benefits and Ramifications
Besides the obvious advantage of the organization being able to comprehend what DG means, there is
also the beginning of seeing the specific areas where DG can clearly add value.
Approach Considerations
If you are doing DG for a very visible effort or for a large organization with a wide scope, then consider
some professional help with regard to messaging, the picture, or even animated media.
Sample Output
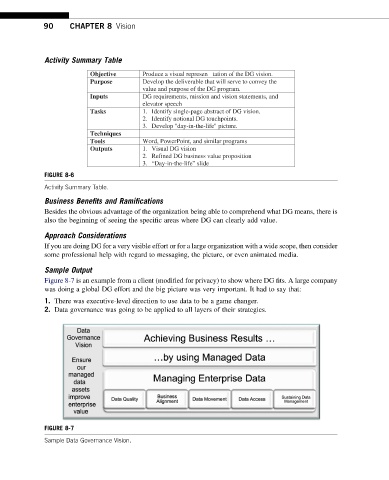
Figure 8-7 is an example from a client (modified for privacy) to show where DG fits. A large company
was doing a global DG effort and the big picture was very important. It had to say that:
1. There was executive-level direction to use data to be a game changer.
2. Data governance was going to be applied to all layers of their strategies.
FIGURE 8-7
Sample Data Governance Vision.