
Page 183 - Decision Making Applications in Modern Power Systems
P. 183
Modeling and simulation Chapter | 5 147
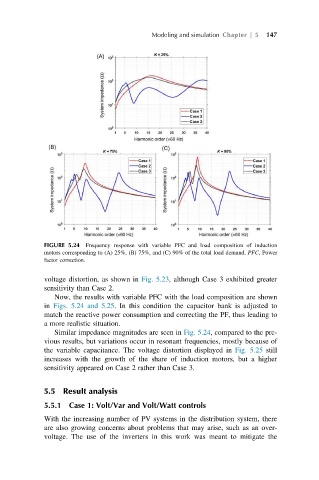
FIGURE 5.24 Frequency response with variable PFC and load composition of induction
motors corresponding to (A) 25%, (B) 75%, and (C) 90% of the total load demand. PFC, Power
factor correction.
voltage distortion, as shown in Fig. 5.23, although Case 3 exhibited greater
sensitivity than Case 2.
Now, the results with variable PFC with the load composition are shown
in Figs. 5.24 and 5.25. In this condition the capacitor bank is adjusted to
match the reactive power consumption and correcting the PF, thus leading to
a more realistic situation.
Similar impedance magnitudes are seen in Fig. 5.24, compared to the pre-
vious results, but variations occur in resonant frequencies, mostly because of
the variable capacitance. The voltage distortion displayed in Fig. 5.25 still
increases with the growth of the share of induction motors, but a higher
sensitivity appeared on Case 2 rather than Case 3.
5.5 Result analysis
5.5.1 Case 1: Volt/Var and Volt/Watt controls
With the increasing number of PV systems in the distribution system, there
are also growing concerns about problems that may arise, such as an over-
voltage. The use of the inverters in this work was meant to mitigate the