
Page 181 - Decision Making Applications in Modern Power Systems
P. 181
Modeling and simulation Chapter | 5 145
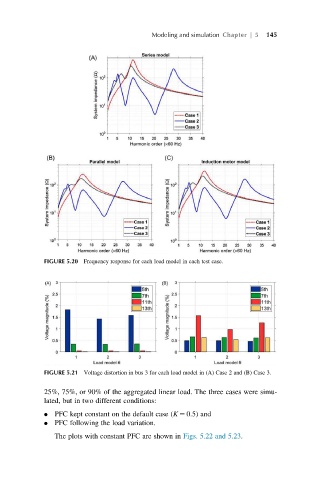
FIGURE 5.20 Frequency response for each load model in each test case.
FIGURE 5.21 Voltage distortion in bus 3 for each load model in (A) Case 2 and (B) Case 3.
25%, 75%, or 90% of the aggregated linear load. The three cases were simu-
lated, but in two different conditions:
PFC kept constant on the default case (K 5 0.5) and
PFC following the load variation.
The plots with constant PFC are shown in Figs. 5.22 and 5.23.