
Page 180 - Decision Making Applications in Modern Power Systems
P. 180
144 Decision Making Applications in Modern Power Systems
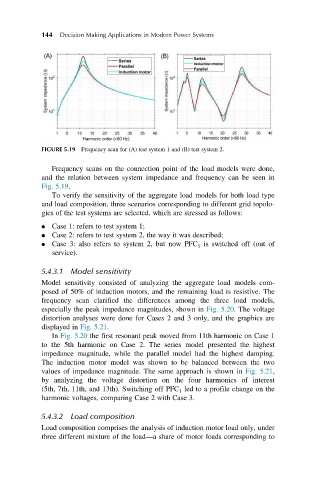
FIGURE 5.19 Frequency scan for (A) test system 1 and (B) test system 2.
Frequency scans on the connection point of the load models were done,
and the relation between system impedance and frequency can be seen in
Fig. 5.19.
To verify the sensitivity of the aggregate load models for both load type
and load composition, three scenarios corresponding to different grid topolo-
gies of the test systems are selected, which are stressed as follows:
Case 1: refers to test system 1;
Case 2: refers to test system 2, the way it was described;
Case 3: also refers to system 2, but now PFC 1 is switched off (out of
service).
5.4.3.1 Model sensitivity
Model sensitivity consisted of analyzing the aggregate load models com-
posed of 50% of induction motors, and the remaining load is resistive. The
frequency scan clarified the differences among the three load models,
especially the peak impedance magnitudes, shown in Fig. 5.20. The voltage
distortion analyses were done for Cases 2 and 3 only, and the graphics are
displayed in Fig. 5.21.
In Fig. 5.20 the first resonant peak moved from 11th harmonic on Case 1
to the 5th harmonic on Case 2. The series model presented the highest
impedance magnitude, while the parallel model had the highest damping.
The induction motor model was shown to be balanced between the two
values of impedance magnitude. The same approach is shown in Fig. 5.21,
by analyzing the voltage distortion on the four harmonics of interest
(5th, 7th, 11th, and 13th). Switching off PFC 1 led to a profile change on the
harmonic voltages, comparing Case 2 with Case 3.
5.4.3.2 Load composition
Load composition comprises the analysis of induction motor load only, under
three different mixture of the load—a share of motor loads corresponding to