
Page 200 - Decision Making Applications in Modern Power Systems
P. 200
Adaptive estimation and tracking of power quality disturbances Chapter | 6 163
1.8
RLS
1.6 LMS
Estimated amplitude 1.2 1
NLMS
1.4
0.8
0.6
0.4
0.2
0
0 0.1 0.2 0.3 0.4 0.5 0.6 0.7 0.8 0.9 1
Time in seconds
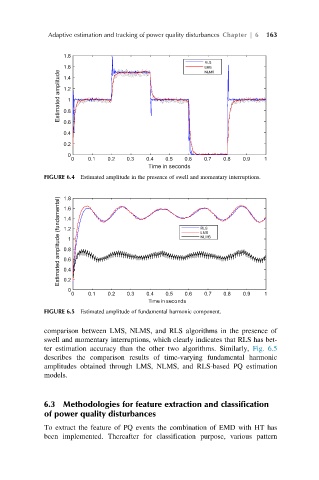
FIGURE 6.4 Estimated amplitude in the presence of swell and momentary interruptions.
1.8
Estimated amplitude (fundamental) 1.4 1 RLS
1.6
1.2
LMS
NLMS
0.8
0.6
0.4
0.2
0
0 0.1 0.2 0.3 0.4 0.5 0.6 0.7 0.8 0.9 1
Time in seconds
FIGURE 6.5 Estimated amplitude of fundamental harmonic component.
comparison between LMS, NLMS, and RLS algorithms in the presence of
swell and momentary interruptions, which clearly indicates that RLS has bet-
ter estimation accuracy than the other two algorithms. Similarly, Fig. 6.5
describes the comparison results of time-varying fundamental harmonic
amplitudes obtained through LMS, NLMS, and RLS-based PQ estimation
models.
6.3 Methodologies for feature extraction and classification
of power quality disturbances
To extract the feature of PQ events the combination of EMD with HT has
been implemented. Thereafter for classification purpose, various pattern