
Page 205 - Decision Making Applications in Modern Power Systems
P. 205
168 Decision Making Applications in Modern Power Systems
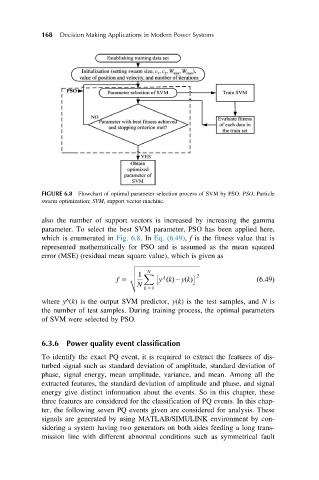
FIGURE 6.8 Flowchart of optimal parameter selection process of SVM by PSO. PSO, Particle
swarm optimization; SVM, support vector machine.
also the number of support vectors is increased by increasing the gamma
parameter. To select the best SVM parameter, PSO has been applied here,
which is enumerated in Fig. 6.8.In Eq. (6.49), f is the fitness value that is
represented mathematically for PSO and is assumed as the mean squared
error (MSE) (residual mean square value), which is given as
v ffiffiffiffiffiffiffiffiffiffiffiffiffiffiffiffiffiffiffiffiffiffiffiffiffiffiffiffiffiffiffiffiffiffiffiffiffiffiffiffiffi
u N
u 1 X 2
Λ
f 5 t y ðkÞ2yðkÞ ð6:49Þ
N
k 51
where y^(k) is the output SVM predictor, y(k) is the test samples, and N is
the number of test samples. During training process, the optimal parameters
of SVM were selected by PSO.
6.3.6 Power quality event classification
To identify the exact PQ event, it is required to extract the features of dis-
turbed signal such as standard deviation of amplitude, standard deviation of
phase, signal energy, mean amplitude, variance, and mean. Among all the
extracted features, the standard deviation of amplitude and phase, and signal
energy give distinct information about the events. So in this chapter, these
three features are considered for the classification of PQ events. In this chap-
ter, the following seven PQ events given are considered for analysis. These
signals are generated by using MATLAB/SIMULINK environment by con-
sidering a system having two generators on both sides feeding a long trans-
mission line with different abnormal conditions such as symmetrical fault