
Page 207 - Decision Making Applications in Modern Power Systems
P. 207
170 Decision Making Applications in Modern Power Systems
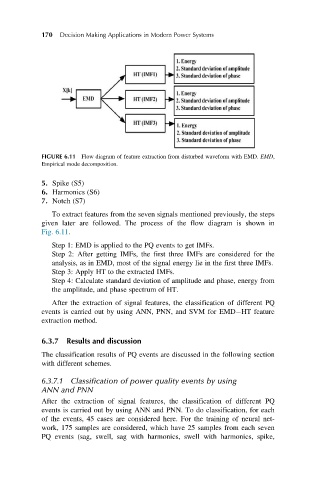
FIGURE 6.11 Flow diagram of feature extraction from disturbed waveform with EMD. EMD,
Empirical mode decomposition.
5. Spike (S5)
6. Harmonics (S6)
7. Notch (S7)
To extract features from the seven signals mentioned previously, the steps
given later are followed. The process of the flow diagram is shown in
Fig. 6.11.
Step 1: EMD is applied to the PQ events to get IMFs.
Step 2: After getting IMFs, the first three IMFs are considered for the
analysis, as in EMD, most of the signal energy lie in the first three IMFs.
Step 3: Apply HT to the extracted IMFs.
Step 4: Calculate standard deviation of amplitude and phase, energy from
the amplitude, and phase spectrum of HT.
After the extraction of signal features, the classification of different PQ
events is carried out by using ANN, PNN, and SVM for EMD HT feature
extraction method.
6.3.7 Results and discussion
The classification results of PQ events are discussed in the following section
with different schemes.
6.3.7.1 Classification of power quality events by using
ANN and PNN
After the extraction of signal features, the classification of different PQ
events is carried out by using ANN and PNN. To do classification, for each
of the events, 45 cases are considered here. For the training of neural net-
work, 175 samples are considered, which have 25 samples from each seven
PQ events (sag, swell, sag with harmonics, swell with harmonics, spike,