
Page 208 - Decision Making Applications in Modern Power Systems
P. 208
Adaptive estimation and tracking of power quality disturbances Chapter | 6 171
FIGURE 6.12 Plot for PQ events with EMD HT ANN. EMD, Empirical mode decomposi-
tion; HT, Hilbert transform; PQ, power quality.
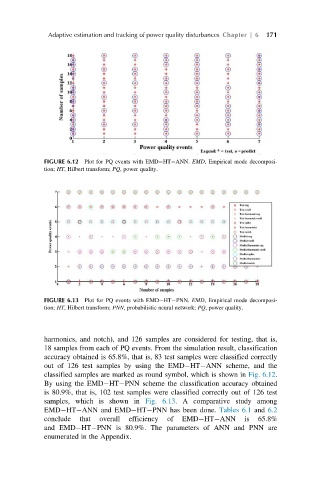
FIGURE 6.13 Plot for PQ events with EMD HT PNN. EMD, Empirical mode decomposi-
tion; HT, Hilbert transform; PNN, probabilistic neural network; PQ, power quality.
harmonics, and notch), and 126 samples are considered for testing, that is,
18 samples from each of PQ events. From the simulation result, classification
accuracy obtained is 65.8%, that is, 83 test samples were classified correctly
out of 126 test samples by using the EMD HT ANN scheme, and the
classified samples are marked as round symbol, which is shown in Fig. 6.12.
By using the EMD HT PNN scheme the classification accuracy obtained
is 80.9%, that is, 102 test samples were classified correctly out of 126 test
samples, which is shown in Fig. 6.13. A comparative study among
EMD HT ANN and EMD HT PNN has been done. Tables 6.1 and 6.2
conclude that overall efficiency of EMD HT ANN is 65.8%
and EMD HT PNN is 80.9%. The parameters of ANN and PNN are
enumerated in the Appendix.