
Page 210 - Decision Making Applications in Modern Power Systems
P. 210
Adaptive estimation and tracking of power quality disturbances Chapter | 6 173
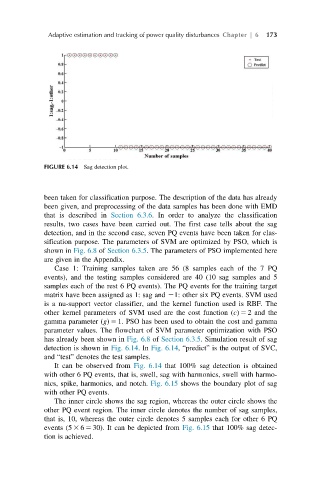
FIGURE 6.14 Sag detection plot.
been taken for classification purpose. The description of the data has already
been given, and preprocessing of the data samples has been done with EMD
that is described in Section 6.3.6. In order to analyze the classification
results, two cases have been carried out. The first case tells about the sag
detection, and in the second case, seven PQ events have been taken for clas-
sification purpose. The parameters of SVM are optimized by PSO, which is
shown in Fig. 6.8 of Section 6.3.5. The parameters of PSO implemented here
are given in the Appendix.
Case 1: Training samples taken are 56 (8 samples each of the 7 PQ
events), and the testing samples considered are 40 (10 sag samples and 5
samples each of the rest 6 PQ events). The PQ events for the training target
matrix have been assigned as 1: sag and 21: other six PQ events. SVM used
is a nu-support vector classifier, and the kernel function used is RBF. The
other kernel parameters of SVM used are the cost function (c) 5 2 and the
gamma parameter (g) 5 1. PSO has been used to obtain the cost and gamma
parameter values. The flowchart of SVM parameter optimization with PSO
has already been shown in Fig. 6.8 of Section 6.3.5. Simulation result of sag
detection is shown in Fig. 6.14.In Fig. 6.14, “predict” is the output of SVC,
and “test” denotes the test samples.
It can be observed from Fig. 6.14 that 100% sag detection is obtained
with other 6 PQ events, that is, swell, sag with harmonics, swell with harmo-
nics, spike, harmonics, and notch. Fig. 6.15 shows the boundary plot of sag
with other PQ events.
The inner circle shows the sag region, whereas the outer circle shows the
other PQ event region. The inner circle denotes the number of sag samples,
that is, 10, whereas the outer circle denotes 5 samples each for other 6 PQ
events (5 3 6 5 30). It can be depicted from Fig. 6.15 that 100% sag detec-
tion is achieved.