
Page 211 - Decision Making Applications in Modern Power Systems
P. 211
174 Decision Making Applications in Modern Power Systems
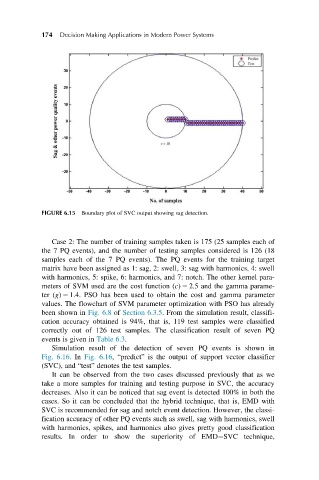
FIGURE 6.15 Boundary plot of SVC output showing sag detection.
Case 2: The number of training samples taken is 175 (25 samples each of
the 7 PQ events), and the number of testing samples considered is 126 (18
samples each of the 7 PQ events). The PQ events for the training target
matrix have been assigned as 1: sag, 2: swell, 3: sag with harmonics, 4: swell
with harmonics, 5: spike, 6: harmonics, and 7: notch. The other kernel para-
meters of SVM used are the cost function (c) 5 2.5 and the gamma parame-
ter (g) 5 1.4. PSO has been used to obtain the cost and gamma parameter
values. The flowchart of SVM parameter optimization with PSO has already
been shown in Fig. 6.8 of Section 6.3.5. From the simulation result, classifi-
cation accuracy obtained is 94%, that is, 119 test samples were classified
correctly out of 126 test samples. The classification result of seven PQ
events is given in Table 6.3.
Simulation result of the detection of seven PQ events is shown in
Fig. 6.16.In Fig. 6.16, “predict” is the output of support vector classifier
(SVC), and “test” denotes the test samples.
It can be observed from the two cases discussed previously that as we
take a more samples for training and testing purpose in SVC, the accuracy
decreases. Also it can be noticed that sag event is detected 100% in both the
cases. So it can be concluded that the hybrid technique, that is, EMD with
SVC is recommended for sag and notch event detection. However, the classi-
fication accuracy of other PQ events such as swell, sag with harmonics, swell
with harmonics, spikes, and harmonics also gives pretty good classification
results. In order to show the superiority of EMD SVC technique,