
Page 212 - Decision Making Applications in Modern Power Systems
P. 212
Adaptive estimation and tracking of power quality disturbances Chapter | 6 175
TABLE 6.3 Classification accuracy of seven power quality events.
Sl. Power quality Total no. No. of samples Classification
no. event of samples classified correctly accuracy (%)
1 S1 18 18 100
2 S2 18 17 94.4
3 S3 18 16 88.8
4 S4 18 17 94.4
5 S5 18 17 94.4
6 S6 18 16 88.8
7 S7 18 18 100
Overall classification accuracy 94.4
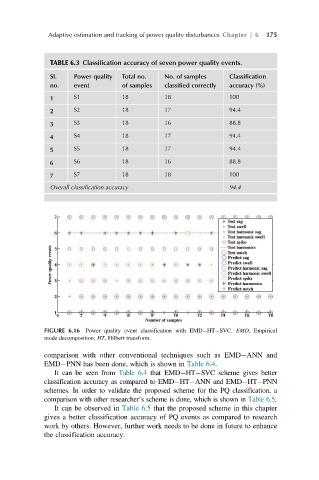
FIGURE 6.16 Power quality event classification with EMD HT SVC. EMD, Empirical
mode decomposition; HT, Hilbert transform.
comparison with other conventional techniques such as EMD ANN and
EMD PNN has been done, which is shown in Table 6.4.
It canbeseenfrom Table 6.4 that EMD HT SVC scheme gives better
classificationaccuracyascomparedtoEMD HT ANN and EMD HT PNN
schemes. In order to validate the proposed scheme for the PQ classification, a
comparison with other researcher’s scheme is done, which is shown in Table 6.5.
It can be observed in Table 6.5 that the proposed scheme in this chapter
gives a better classification accuracy of PQ events as compared to research
work by others. However, further work needs to be done in future to enhance
the classification accuracy.