
Page 361 - Decision Making Applications in Modern Power Systems
P. 361
Heuristic methods for the evaluation of environmental impacts Chapter | 12 323
TABLE 12.10 Characteristic data of the case study of the plant generators.
Generator c i ($/MW) b i ($/W) a i ($) P min (MW) P max (MW)
PG1 0.15247 38.53973 756.79886 0.76 3.36
PG2 0.10587 46.15916 451.32513 0.76 3.36
PG3 0.02803 40.3965 1049.9977 0.76 3.36
PG4 0.03546 38.30553 1243.5311 0.76 3.36
PG5 0.02111 36.32782 1658.5596 0.76 3.36
PG6 0.01799 38.27041 1356.6592 0.76 3.36
PG7 0.02682 45.27041 1260.6592 0.76 3.36
PG8 0.02700 46.27041 1266.6592 0.76 3.36
PG9 0.02754 47.27041 1287.6592 0.76 3.36
PG10 0.02799 48.27041 1290.6592 0.76 3.36
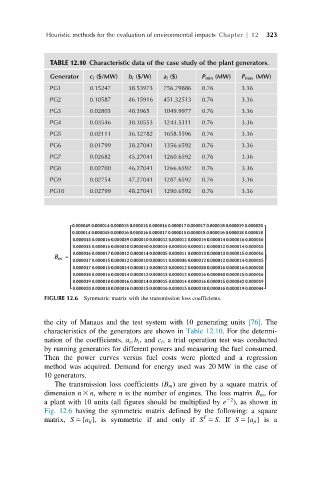
FIGURE 12.6 Symmetric matrix with the transmission loss coefficients.
the city of Manaus and the test system with 10 generating units [76].The
characteristics of the generators are shown in Table 12.10. For the determi-
nation of the coefficients, a i ; b i , and c i , a trial operation test was conducted
by running generators for different powers and measuring the fuel consumed.
Then the power curves versus fuel costs were plotted and a regression
method was acquired. Demand for energy used was 20 MW in the case of
10 generators.
The transmission loss coefficients (B m ) are given by a square matrix of
dimension n 3 n, where n is the number of engines. The loss matrix B m , for
22
a plant with 10 units (all figures should be multiplied by e ), as shown in
Fig. 12.6 having the symmetric matrix defined by the following: a square
T
matrix, S 5 [a ij ], is symmetric if and only if S 5 S.If S 5 [a ji ]isa