
Page 364 - Decision Making Applications in Modern Power Systems
P. 364
326 Decision Making Applications in Modern Power Systems
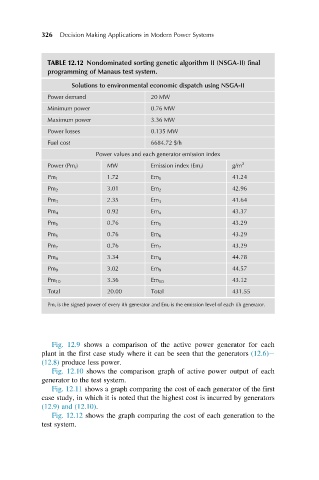
TABLE 12.12 Nondominated sorting genetic algorithm II (NSGA-II) final
programming of Manaus test system.
Solutions to environmental economic dispatch using NSGA-II
Power demand 20 MW
Minimum power 0.76 MW
Maximum power 3.36 MW
Power losses 0.135 MW
Fuel cost 6684.72 $/h
Power values and each generator emission index
Power (Pm i ) MW Emission index (Em i ) g/m 3
Pm 1 1.72 Em 1 41.24
Pm 2 3.01 Em 2 42.96
2.35 41.64
Pm 3 Em 3
Pm 4 0.92 Em 4 43.37
0.76 43.29
Pm 5 Em 5
Pm 6 0.76 Em 6 43.29
0.76 43.29
Pm 7 Em 7
Pm 8 3.34 Em 8 44.78
Pm 9 3.02 Em 9 44.57
Pm 10 3.36 Em 10 43.12
Total 20.00 Total 431.55
Pm i is the signed power of every ith generator and Em i is the emission level of each ith generator.
Fig. 12.9 shows a comparison of the active power generator for each
plant in the first case study where it can be seen that the generators (12.6)
(12.8) produce less power.
Fig. 12.10 shows the comparison graph of active power output of each
generator to the test system.
Fig. 12.11 shows a graph comparing the cost of each generator of the first
case study, in which it is noted that the highest cost is incurred by generators
(12.9) and (12.10).
Fig. 12.12 shows the graph comparing the cost of each generation to the
test system.