
Page 367 - Decision Making Applications in Modern Power Systems
P. 367
Heuristic methods for the evaluation of environmental impacts Chapter | 12 329
Graphical of the power generators
300
250
200
Power 150
100
50
0
0 2 4 6 8 10 12
Generators
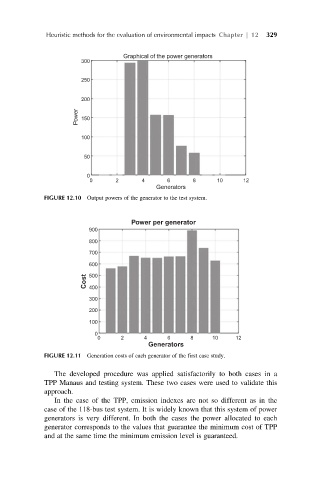
FIGURE 12.10 Output powers of the generator to the test system.
Power per generator
900
800
700
600
Cost 500
400
300
200
100
0
0 2 4 6 8 10 12
Generators
FIGURE 12.11 Generation costs of each generator of the first case study.
The developed procedure was applied satisfactorily to both cases in a
TPP Manaus and testing system. These two cases were used to validate this
approach.
In the case of the TPP, emission indexes are not so different as in the
case of the 118-bus test system. It is widely known that this system of power
generators is very different. In both the cases the power allocated to each
generator corresponds to the values that guarantee the minimum cost of TPP
and at the same time the minimum emission level is guaranteed.