
Page 366 - Decision Making Applications in Modern Power Systems
P. 366
328 Decision Making Applications in Modern Power Systems
× 10 7 Generation 400 / 400
2.74
2.73
obj 2 : Emissions index (g/m 3 ) 2.71
2.72
2.7
2.69
2.68
2.67
2.66
2.65
2.64
0 1 2 3 4 5 6
obj 1 : Cost ($/h)
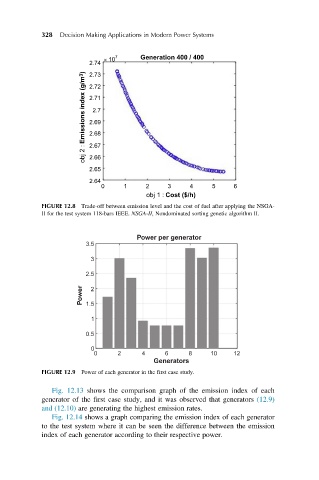
FIGURE 12.8 Trade-off between emission level and the cost of fuel after applying the NSGA-
II for the test system 118-bars IEEE. NSGA-II, Nondominated sorting genetic algorithm II.
Power per generator
3.5
3
2.5
Power 1.5 2
1
0.5
0
0 2 4 6 8 10 12
Generators
FIGURE 12.9 Power of each generator in the first case study.
Fig. 12.13 shows the comparison graph of the emission index of each
generator of the first case study, and it was observed that generators (12.9)
and (12.10) are generating the highest emission rates.
Fig. 12.14 shows a graph comparing the emission index of each generator
to the test system where it can be seen the difference between the emission
index of each generator according to their respective power.