Page 368 - Decision Making Applications in Modern Power Systems
P. 368

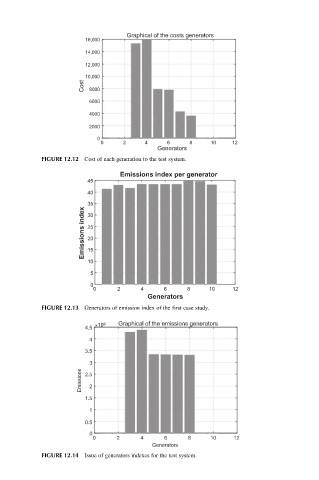
Graphical of the costs generators
                        16,000
                        14,000
                        12,000
                        10,000
                        Cost  8000

                         6000
                         4000
                         2000
                           0
                            0     2     4     6     8     10    12
                                            Generators
            FIGURE 12.12 Cost of each generation to the test system.

                                 Emissions index per generator
                         45
                         40
                        Emissions index 35
                         30
                         25
                         20
                         15
                         10
                         5
                         0
                          0      2     4     6      8     10    12
                                         Generators
            FIGURE 12.13 Generators of emission index of the first case study.
                           ×10 6  Graphical of the emissions generators
                        4.5
                         4
                        3.5
                         3
                       Emissions  2.5 2


                        1.5
                         1
                        0.5
                         0
                          0      2     4     6      8     10    12
                                          Generators
            FIGURE 12.14 Issue of generators indexes for the test system.
   363   364   365   366   367   368   369   370   371   372   373