
Page 136 - Defrosting for Air Source Heat Pump
P. 136
Investigation of effect on uneven defrosting performance 129
28
Circuit 1 Circuit 2 Circuit 3
24
o
4 C 13 s
Tube surface temperature ( o C) 16 8 T > T > T 1 Negative effect 3 1 T > T > T 2
20
Stage 3: Positive effect
T > T
Stage 1:
Stage 2:
No effect
12
T > T > T
3
2
3
1
1
2
3
165 s
o
4.2 C
4
115 s
199 s
118 s 40 s 204 s
0 196 s
80 100 120 140 160 180 200 220
Time (s)
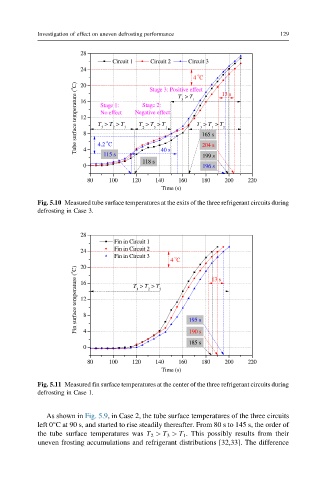
Fig. 5.10 Measured tube surface temperatures at the exits of the three refrigerant circuits during
defrosting in Case 3.
28
Fin in Circuit 1
Fin in Circuit 2
24
Fin in Circuit 3
o
4 C 13 s
20
Fin surface temperature ( o C) 16 8 T > T > T 3 195 s
1
2
12
4
190 s
185 s
0
80 100 120 140 160 180 200 220
Time (s)
Fig. 5.11 Measured fin surface temperatures at the center of the three refrigerant circuits during
defrosting in Case 1.
As shown in Fig. 5.9, in Case 2, the tube surface temperatures of the three circuits
left 0°C at 90 s, and started to rise steadily thereafter. From 80 s to 145 s, the order of
the tube surface temperatures was T 2 > T 3 > T 1 . This possibly results from their
uneven frosting accumulations and refrigerant distributions [32,33]. The difference