
Page 141 - Defrosting for Air Source Heat Pump
P. 141
134 Defrosting for Air Source Heat Pump
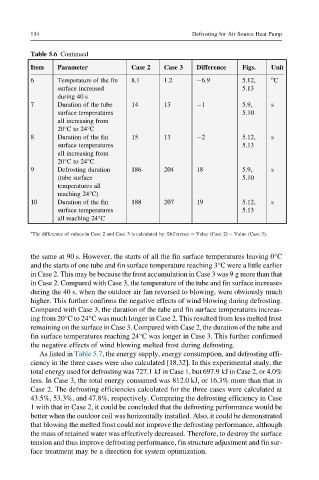
Table 5.6 Continued
Item Parameter Case 2 Case 3 Difference Figs. Unit
6 Temperature of the fin 8.1 1.2 6.9 5.12, o C
surface increased 5.13
during 40 s
7 Duration of the tube 14 13 1 5.9, s
surface temperatures 5.10
all increasing from
20°Cto24°C
8 Duration of the fin 15 13 2 5.12, s
surface temperatures 5.13
all increasing from
20°Cto24°C
9 Defrosting duration 186 204 18 5.9, s
(tube surface 5.10
temperatures all
reaching 24°C)
10 Duration of the fin 188 207 19 5.12, s
surface temperatures 5.13
all reaching 24°C
a
The difference of values in Case 2 and Case 3 is calculated by: Difference ¼ Value (Case 2) Value (Case 3).
the same at 90 s. However, the starts of all the fin surface temperatures leaving 0°C
and the starts of one tube and fin surface temperature reaching 3°C were a little earlier
in Case 2. This may be because the frost accumulation in Case 3 was 9 g more than that
in Case 2. Compared with Case 3, the temperature of the tube and fin surface increases
during the 40 s, when the outdoor air fan reversed to blowing, were obviously much
higher. This further confirms the negative effects of wind blowing during defrosting.
Compared with Case 3, the duration of the tube and fin surface temperatures increas-
ing from 20°Cto24°C was much longer in Case 2. This resulted from less melted frost
remaining on the surface in Case 3. Compared with Case 2, the duration of the tube and
fin surface temperatures reaching 24°C was longer in Case 3. This further confirmed
the negative effects of wind blowing melted frost during defrosting.
As listed in Table 5.7, the energy supply, energy consumption, and defrosting effi-
ciency in the three cases were also calculated [18,32]. In this experimental study, the
total energy used for defrosting was 727.1 kJ in Case 1, but 697.9 kJ in Case 2, or 4.0%
less. In Case 3, the total energy consumed was 812.0 kJ, or 16.3% more than that in
Case 2. The defrosting efficiencies calculated for the three cases were calculated at
43.5%, 53.3%, and 47.8%, respectively. Comparing the defrosting efficiency in Case
1 with that in Case 2, it could be concluded that the defrosting performance would be
better when the outdoor coil was horizontally installed. Also, it could be demonstrated
that blowing the melted frost could not improve the defrosting performance, although
the mass of retained water was effectively decreased. Therefore, to destroy the surface
tension and thus improve defrosting performance, fin structure adjustment and fin sur-
face treatment may be a direction for system optimization.