Page 137 - Defrosting for Air Source Heat Pump
P. 137

130                                         Defrosting for Air Source Heat Pump


                     28
                              Fin in Circuit 1
                     24       Fin in Circuit 2
                              Fin in Circuit 3       o
                                                    4  C    15 s
                     20
                    Fin surface temperature ( o C)  16 8  T  = T 2 3  3  2  T  > T 3  T  = T  = T 3


                              T  > T ; T  > T
                                       1
                     12
                                       1
                                                      1
                            1
                                                         2
                            o
                         8.1  C
                      4
                                                     173 s
                                         135 s       188 s
                      0                  40 s        141 s
                       60    80    100   120   140    160   180   200
                                           Time (s)
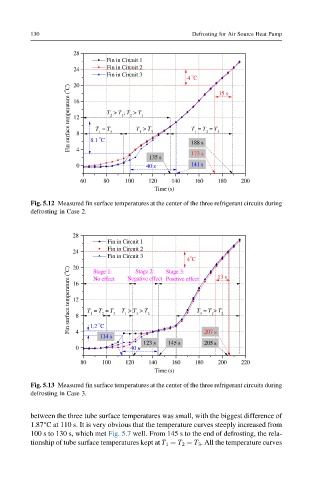
         Fig. 5.12 Measured fin surface temperatures at the center of the three refrigerant circuits during
         defrosting in Case 2.


                     28
                               Fin in Circuit 1
                               Fin in Circuit 2
                     24
                               Fin in Circuit 3     o
                                                    4 C     13 s
                     20
                    Fin surface temperature ( o C)  16 8  T  = T  = T 3  T  > T  > T 2  T  = T > T 2
                                              Stage 3:
                          Stage 1:
                                      Stage 2:
                                              Positive effect
                                   Negative effect
                          No effect
                     12
                                                          1
                                                       3
                                      3
                          1
                             2
                                   1
                            o
                         1.2  C
                     4
                            114 s                       207 s
                                        123 s  145 s    205 s
                     0              40 s
                       80    100   120   140   160    180   200   220
                                           Time (s)
         Fig. 5.13 Measured fin surface temperatures at the center of the three refrigerant circuits during
         defrosting in Case 3.
         between the three tube surface temperatures was small, with the biggest difference of
         1.87°C at 110 s. It is very obvious that the temperature curves steeply increased from
         100 s to 130 s, which met Fig. 5.7 well. From 145 s to the end of defrosting, the rela-
         tionship of tube surface temperatures kept at T 1 ¼ T 2 ¼ T 3 . All the temperature curves
   132   133   134   135   136   137   138   139   140   141   142