
Page 153 - Defrosting for Air Source Heat Pump
P. 153
146 Defrosting for Air Source Heat Pump
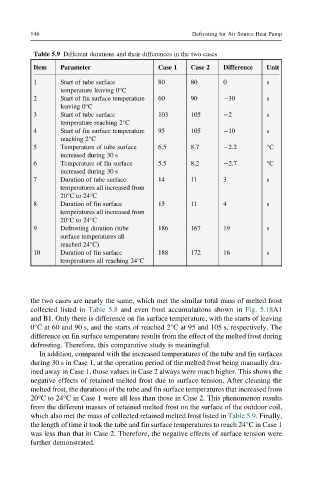
Table 5.9 Different durations and their differences in the two cases
Item Parameter Case 1 Case 2 Difference Unit
1 Start of tube surface 80 80 0 s
temperature leaving 0°C
2 Start of fin surface temperature 60 90 30 s
leaving 0°C
3 Start of tube surface 103 105 2 s
temperature reaching 2°C
4 Start of fin surface temperature 95 105 10 s
reaching 2°C
5 Temperature of tube surface 6.5 8.7 2.2 °C
increased during 30 s
6 Temperature of fin surface 5.5 8.2 2.7 °C
increased during 30 s
7 Duration of tube surface 14 11 3 s
temperatures all increased from
20°Cto24°C
8 Duration of fin surface 15 11 4 s
temperatures all increased from
20°Cto24°C
9 Defrosting duration (tube 186 167 19 s
surface temperatures all
reached 24°C)
10 Duration of fin surface 188 172 16 s
temperatures all reaching 24°C
the two cases are nearly the same, which met the similar total mass of melted frost
collected listed in Table 5.8 and even frost accumulations shown in Fig. 5.18A1
and B1. Only there is difference on fin surface temperature, with the starts of leaving
0°C at 60 and 90 s, and the starts of reached 2°C at 95 and 105 s, respectively. The
difference on fin surface temperature results from the effect of the melted frost during
defrosting. Therefore, this comparative study is meaningful.
In addition, compared with the increased temperatures of the tube and fin surfaces
during 30 s in Case 1, at the operation period of the melted frost being manually dra-
ined away in Case 1, those values in Case 2 always were much higher. This shows the
negative effects of retained melted frost due to surface tension. After cleaning the
melted frost, the durations of the tube and fin surface temperatures that increased from
20°Cto 24°C in Case 1 were all less than those in Case 2. This phenomenon results
from the different masses of retained melted frost on the surface of the outdoor coil,
which also met the mass of collected retained melted frost listed in Table 5.9. Finally,
the length of time it took the tube and fin surface temperatures to reach 24°C in Case 1
was less than that in Case 2. Therefore, the negative effects of surface tension were
further demonstrated.