
Page 151 - Defrosting for Air Source Heat Pump
P. 151
144 Defrosting for Air Source Heat Pump
28
Fin in Circuit 1
Fin in Circuit 2
24
Fin in Circuit 3 o
4 C 15 s
20
Fin surface temperature ( o C) 16 8 T = T 3 2 3 2 T > T 3 T = T = T 3
T > T ; T > T
1
1
1
1
2
12
o
5.5 C
4
95 s 135 s 173 s 188 s
0 30 s
60 80 100 120 140 160 180 200
Time (s)
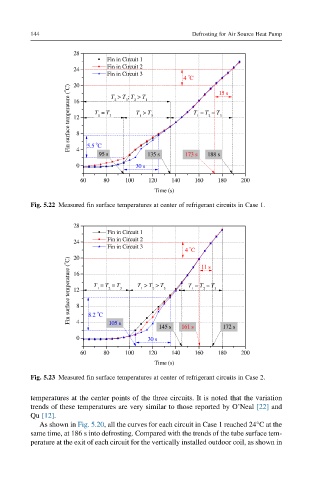
Fig. 5.22 Measured fin surface temperatures at center of refrigerant circuits in Case 1.
28
Fin in Circuit 1
24 Fin in Circuit 2
Fin in Circuit 3 o
4 C 11 s
20
Fin surface temperature ( o C) 16 8 T = T = T 3 T > T > T 3 T = T = T 3
2
1
1
2
12
1
2
o
8.2 C
4
105 s
145 s 161 s 172 s
0 30 s
60 80 100 120 140 160 180 200
Time (s)
Fig. 5.23 Measured fin surface temperatures at center of refrigerant circuits in Case 2.
temperatures at the center points of the three circuits. It is noted that the variation
trends of these temperatures are very similar to those reported by O’Neal [22] and
Qu [12].
As shown in Fig. 5.20, all the curves for each circuit in Case 1 reached 24°C at the
same time, at 186 s into defrosting. Compared with the trends of the tube surface tem-
perature at the exit of each circuit for the vertically installed outdoor coil, as shown in