
Page 148 - Defrosting for Air Source Heat Pump
P. 148
Investigation of effect on uneven defrosting performance 141
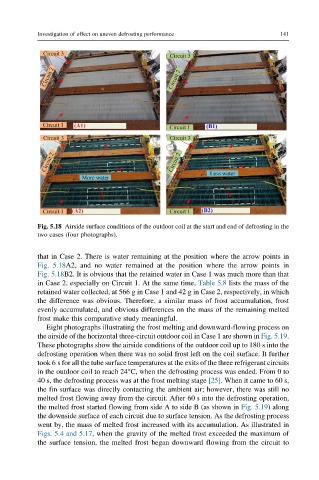
Fig. 5.18 Airside surface conditions of the outdoor coil at the start and end of defrosting in the
two cases (four photographs).
that in Case 2. There is water remaining at the position where the arrow points in
Fig. 5.18A2, and no water remained at the position where the arrow points in
Fig. 5.18B2. It is obvious that the retained water in Case 1 was much more than that
in Case 2, especially on Circuit 1. At the same time, Table 5.8 lists the mass of the
retained water collected, at 566 g in Case 1 and 42 g in Case 2, respectively, in which
the difference was obvious. Therefore, a similar mass of frost accumulation, frost
evenly accumulated, and obvious differences on the mass of the remaining melted
frost make this comparative study meaningful.
Eight photographs illustrating the frost melting and downward-flowing process on
the airside of the horizontal three-circuit outdoor coil in Case 1 are shown in Fig. 5.19.
These photographs show the airside conditions of the outdoor coil up to 180 s into the
defrosting operation when there was no solid frost left on the coil surface. It further
took 6 s for all the tube surface temperatures at the exits of the three refrigerant circuits
in the outdoor coil to reach 24°C, when the defrosting process was ended. From 0 to
40 s, the defrosting process was at the frost melting stage [25]. When it came to 60 s,
the fin surface was directly contacting the ambient air; however, there was still no
melted frost flowing away from the circuit. After 60 s into the defrosting operation,
the melted frost started flowing from side A to side B (as shown in Fig. 5.19) along
the downside surface of each circuit due to surface tension. As the defrosting process
went by, the mass of melted frost increased with its accumulation. As illustrated in
Figs. 5.4 and 5.17, when the gravity of the melted frost exceeded the maximum of
the surface tension, the melted frost began downward flowing from the circuit to