Page 150 - Defrosting for Air Source Heat Pump
P. 150

Investigation of effect on uneven defrosting performance          143

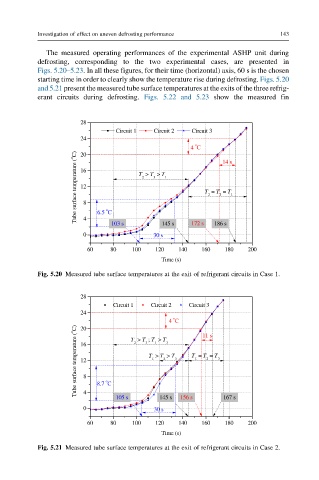
              The measured operating performances of the experimental ASHP unit during
           defrosting, corresponding to the two experimental cases, are presented in
           Figs. 5.20–5.23. In all these figures, for their time (horizontal) axis, 60 s is the chosen
           starting time in order to clearly show the temperature rise during defrosting. Figs. 5.20
           and 5.21 present the measured tube surface temperatures at the exits of the three refrig-
           erant circuits during defrosting. Figs. 5.22 and 5.23 show the measured fin


                       28
                                 Circuit 1     Circuit 2     Circuit 3
                       24
                                                      o
                                                     4  C    14 s
                      Tube surface temperature ( o C)  16 8  o  T  > T  > T 1  T  = T  = T 1
                       20

                                       2
                                           3
                       12
                                                            3
                                                         2


                        0 4  6.5  C 103 s  30 s 145 s  172 s  186 s

                         60    80    100   120   140   160    180   200
                                             Time (s)

           Fig. 5.20 Measured tube surface temperatures at the exit of refrigerant circuits in Case 1.


                       28
                                Circuit 1     Circuit 2     Circuit 3
                       24
                                                o
                                               4  C     11 s
                      Tube surface temperature ( o C)  16 8  8.7  C  2  3  T  > T  > T 3  T  = T  = T 3
                       20
                                    T  > T ; T  > T
                                              3
                                           1
                                                      1
                                                         2
                                          1
                                             2
                       12
                              o
                                            145 s
                        0 4     105 s      30 s   156 s      167 s

                         60    80    100   120   140   160    180   200
                                             Time (s)
           Fig. 5.21 Measured tube surface temperatures at the exit of refrigerant circuits in Case 2.
   145   146   147   148   149   150   151   152   153   154   155