
Page 312 - Defrosting for Air Source Heat Pump
P. 312
Technoeconomic performances 307
Experimental results that were acquired in the following economic analysis process
mainly came from defrosting experiments. As shown in Fig. 10.2, the prototype com-
pared condition was Fig. 10.2A, without valves installed for an ASHP unit. In
Fig. 10.2B, the valves were installed at each circuit, and thus the refrigerant distribu-
tion could be adjusted. Two defrosting experimental cases were designed and listed in
Table 10.3. In this study, frosting duration was designed at 60 min and 70 min for a
frosting/defrosting cycle. To keep the compressor safe, two periods of 3–4 min were
left for its shutdown. Clearly, after the valves were installed, the FEC should be
higher at the start of defrosting operations. Therefore, the FECs were at FEC 3 and
FEC 4 in the two defrosting experimental cases, respectively. And FEC 4 was much
higher than FEC 3 .
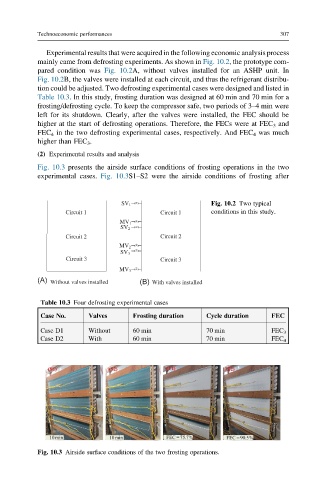
(2) Experimental results and analysis
Fig. 10.3 presents the airside surface conditions of frosting operations in the two
experimental cases. Fig. 10.3S1–S2 were the airside conditions of frosting after
Fig. 10.2 Two typical
SV 1
Circuit 1 Circuit 1 conditions in this study.
MV 1
SV 2
Circuit 2 Circuit 2
MV 2
SV 3
Circuit 3 Circuit 3
MV 3
(A) Without valves installed (B) With valves installed
Table 10.3 Four defrosting experimental cases
Case No. Valves Frosting duration Cycle duration FEC
Case D1 Without 60 min 70 min FEC 3
Case D2 With 60 min 70 min FEC 4
Fig. 10.3 Airside surface conditions of the two frosting operations.