
Page 313 - Defrosting for Air Source Heat Pump
P. 313
308 Defrosting for Air Source Heat Pump
starting for 10 min, and Fig. 10.3T1–T2 their termination status. The frosting study
shows that when the opening degrees of the valves were different, their FECs were
different. As listed in Table 10.4, the FEC 1 was at 75.7%, and the FEC 2 at 90.5%,
respectively. Also, Table 10.4 lists the experimental results of the two frosting cases.
In Case F1, the COP was 4.10, and indoor heat supplied was 11,116 kJ. In Case F2, the
two values were 4.26 and 11,543 kJ, respectively. In addition, the COP and indoor
heat supplied in the first 10 min were specially listed, which would be used in the later
calculations. All the values in Case F1 were lower than those in Case F2, which also
showed the energy performances of an ASHP unit after the valves were installed.
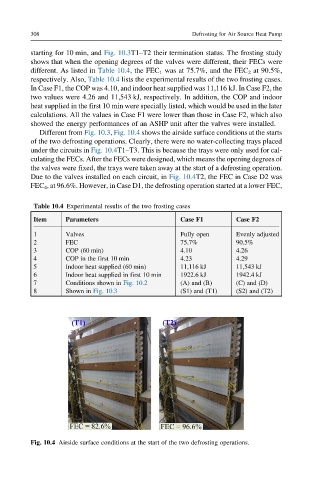
Different from Fig. 10.3, Fig. 10.4 shows the airside surface conditions at the starts
of the two defrosting operations. Clearly, there were no water-collecting trays placed
under the circuits in Fig. 10.4T1–T3. This is because the trays were only used for cal-
culating the FECs. After the FECs were designed, which means the opening degrees of
the valves were fixed, the trays were taken away at the start of a defrosting operation.
Due to the valves installed on each circuit, in Fig. 10.4T2, the FEC in Case D2 was
FEC 4 , at 96.6%. However, in Case D1, the defrosting operation started at a lower FEC,
Table 10.4 Experimental results of the two frosting cases
Item Parameters Case F1 Case F2
1 Valves Fully open Evenly adjusted
2 FEC 75.7% 90.5%
3 COP (60 min) 4.10 4.26
4 COP in the first 10 min 4.23 4.29
5 Indoor heat supplied (60 min) 11,116 kJ 11,543 kJ
6 Indoor heat supplied in first 10 min 1922.6 kJ 1942.4 kJ
7 Conditions shown in Fig. 10.2 (A) and (B) (C) and (D)
8 Shown in Fig. 10.3 (S1) and (T1) (S2) and (T2)
Fig. 10.4 Airside surface conditions at the start of the two defrosting operations.