
Page 316 - Defrosting for Air Source Heat Pump
P. 316
Technoeconomic performances 311
vi. During frosting, the COP showed a good linear relationship with the FEC (75%–100%).
Thus, the values of the COP at different FECs could be calculated.
vii. During frosting, the indoor heat supplied showed a good linear relationship with the FEC
(75%–100%). Thus, the values of the indoor heat supplied at different FECs could also be
calculated.
Based on the seven frosting assumptions, fundamental assumptions (xiv) and (xv), and
the data listed in Table 10.4, a series of experimental results in Cases F3 and F4 was
calculated, with their FECs changed from 75.7% and 90.5% to 75.7% and 96.6%,
respectively. Clearly, the FEC in Case F1 is the same as that in Case F3. Therefore,
all the other data were also not changed. However, in Case F4, all the data became
larger than those in Case F2, as its FEC increased. The COP and indoor heat supplied
at different stages were also listed in Table 10.6, which would be used in the later eco-
nomic analysis process.
(3) Defrosting assumptions
Furthermore, in order to calculate the running cost of the ASHP unit at the defrosting
stage, the following assumptions were given:
i. During defrosting, the defrosting duration showed a good linear relationship with the FEC
(75%–100%). Thus, the defrosting durations at different FECs could be calculated.
ii. During defrosting, the total power inputs to the compressor and indoor air fan showed a
good linear relationship with the FEC (75%–100%). Thus, the values of the total power
inputs to the compressor and indoor air fan at different FECs could be calculated.
iii. During defrosting, the energy from the indoor air showed a good linear relationship with the
FEC (75%–100%). The values of the energy from the indoor air at different FECs could be
calculated.
iv. The difference of total frost accumulation in the two cases, 3 g in Table 10.5, was neglected.
Based on the four defrosting assumptions, fundamental assumptions (xiv) and (xv),
and the data listed in Table 10.7, a series of experimental results in Cases D3 and
D4 were calculated, with their FECs changed from 82.6% and 96.6% to 75.7% and
96.6%, respectively. It is obvious that the results in Case D4 were the same as those
in Case D2. This is because their FECs were the same. However, the results in Case D3
were much lower than those in Case D1, which was calculated as the four defrosting
assumptions and their FECs. At the same time, the defrosting duration, the total power
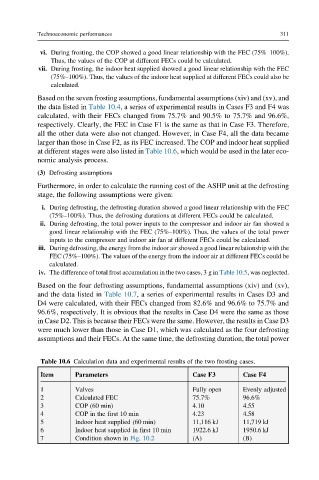
Table 10.6 Calculation data and experimental results of the two frosting cases.
Item Parameters Case F3 Case F4
1 Valves Fully open Evenly adjusted
2 Calculated FEC 75.7% 96.6%
3 COP (60 min) 4.10 4.55
4 COP in the first 10 min 4.23 4.58
5 Indoor heat supplied (60 min) 11,116 kJ 11,719 kJ
6 Indoor heat supplied in first 10 min 1922.6 kJ 1950.6 kJ
7 Condition shown in Fig. 10.2 (A) (B)