
Page 323 - Defrosting for Air Source Heat Pump
P. 323
318 Defrosting for Air Source Heat Pump
Q id,air,F + Q id,air,DF Q id,air,NFDH Q C
C r,D4 ¼ + + (10.38)
COP F COP NFDH COP C
+ C r,comp,DF + C r,id, fan,DF + C ASHP + C i,V
Based on all the listed assumptions and known experimental data, all the costs in the
four typical cases could be calculated with the 38 equations listed in this section.
10.2.2 Results and discussions
All the calculation results are shown in Figs. 10.7–10.14. Among them, the running
costs of the two typical cases are presented in Figs. 10.7, 10.9, and 10.10, and the total
costs are shown in Figs. 10.11 and 10.12.In Fig. 10.12, the ratio of the total cost dif-
ferences between the two cases in the 15 operating years is shown. This is followed by
Figs. 10.13 and 10.14, which showed the proportion of the first cost and the additional
first cost in the total cost, respectively.
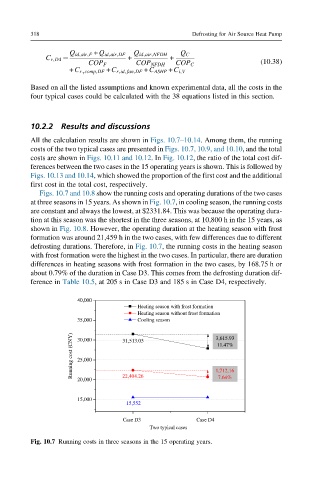
Figs. 10.7 and 10.8 show the running costs and operating durations of the two cases
at three seasons in 15 years. As shown in Fig. 10.7, in cooling season, the running costs
are constant and always the lowest, at $2331.84. This was because the operating dura-
tion at this season was the shortest in the three seasons, at 10,800 h in the 15 years, as
shown in Fig. 10.8. However, the operating duration at the heating season with frost
formation was around 21,459 h in the two cases, with few differences due to different
defrosting durations. Therefore, in Fig. 10.7, the running costs in the heating season
with frost formation were the highest in the two cases. In particular, there are duration
differences in heating seasons with frost formation in the two cases, by 168.75 h or
about 0.79% of the duration in Case D3. This comes from the defrosting duration dif-
ference in Table 10.5, at 205 s in Case D3 and 185 s in Case D4, respectively.
40,000
Heating season with frost formation
Heating season without frost formation
35,000 Cooling season
)
Y 3,615.93
N 30,000 31,513.03
C 11.47%
(
t
s
o
c 25,000
g
n
i
n
n 1,712.16
u
R 22,404.26 7.64%
20,000
15,000
15,552
Case D3 Case D4
Two typical cases
Fig. 10.7 Running costs in three seasons in the 15 operating years.