
Page 326 - Defrosting for Air Source Heat Pump
P. 326
Technoeconomic performances 321
380
360
5.00
year) 340 15.00
/
Y 320
N
C
(
s 300
e
c 120.00
n
e 280
r
e
f
f
i
d 260
f
o
n 240 First 5 Years Second 5 Years Third 5 Years
o
i Nearly no increase
t Increase rapidly Increase slowly
a
R 220
200
0 1 2 3 4 5 6 7 8 9 10 11 12 13 14 15 16
System operating duration (year)
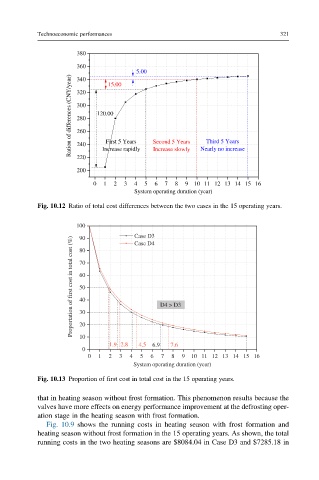
Fig. 10.12 Ratio of total cost differences between the two cases in the 15 operating years.
100
) 90 Case D3
% Case D4
(
t
s 80
o
c
l
a 70
t
o
t
n
i 60
t
s
o
c 50
t
s
r
i
f 40
f
o D4 > D3
n
o 30
i
t
a
t
r
o 20
p
o
r
P 10
1.9 2.8 4.5 6.9 7.6
0
0 1 2 3 4 5 6 7 8 9 10 11 12 13 14 15 16
System operating duration (year)
Fig. 10.13 Proportion of first cost in total cost in the 15 operating years.
that in heating season without frost formation. This phenomenon results because the
valves have more effects on energy performance improvement at the defrosting oper-
ation stage in the heating season with frost formation.
Fig. 10.9 shows the running costs in heating season with frost formation and
heating season without frost formation in the 15 operating years. As shown, the total
running costs in the two heating seasons are $8084.04 in Case D3 and $7285.18 in