Page 340 - Defrosting for Air Source Heat Pump
P. 340

Technoeconomic performances                                       335


                     4000
                              3516.75        D5–D8    D6–D7
                     3500
                     3000     3200.36
                    )
                    Y
                    N  2500               2289.50
                    C
                    (
                    e
                    c  2000
                    n                     2088.58
                    e
                    r
                    e
                    f  1500
                    f
                    i
                    d         1062.25
                    t
                    s
                    o  1000
                    c
                    l          976.78
                    a
                    t
                    o  500
                    T
                        0           0.65
                      –500
                         –2   0    2    4    6    8    10   12   14   16
                                          Operating time (year)
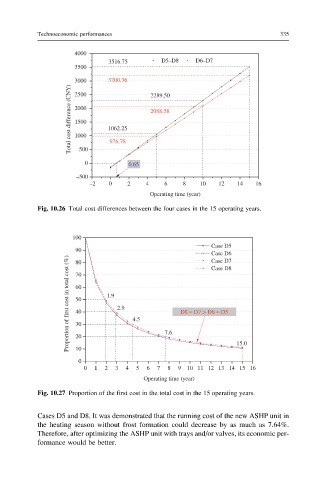
           Fig. 10.26 Total cost differences between the four cases in the 15 operating years.
                     100
                                                           Case D5
                     90
                                                           Case D6
                   )
                   %                                       Case D7
                   (  80

                   t                                       Case D8
                   s
                   o
                   c  70

                   l
                   a
                   t
                   o
                   t  60

                   n
                   i          1.9

                   t
                   s  50
                   o
                   c
                                 2.9
                   t
                   s  40                          D8 ≈ D7 > D6 ≈ D5
                   r
                   i
                   f
                                     4.5
                   f
                   o  30

                   n
                   o
                   i                          7.6
                   t
                   r  20
                   o
                   p                                             15.0
                   o
                   r  10
                   P
                      0
                        0  1  2  3  4  5  6  7  8  9  10 11 12 13 14 15 16
                                        Operating time (year)
           Fig. 10.27 Proportion of the first cost in the total cost in the 15 operating years.
           Cases D5 and D8. It was demonstrated that the running cost of the new ASHP unit in
           the heating season without frost formation could decrease by as much as 7.64%.
           Therefore, after optimizing the ASHP unit with trays and/or valves, its economic per-
           formance would be better.
   335   336   337   338   339   340   341   342   343   344   345