
Page 336 - Defrosting for Air Source Heat Pump
P. 336
Technoeconomic performances 331
Q id,air,F + Q id,air,DF Q id,air,NFDH Q C
C r,D6 ¼ + + (10.40)
COP F COP NFDH COP C
+ C r,comp,DF + C r,id, fan,DF + C ASHP + C f ,T + C i,T ,
Q id,air,F + Q id,air,DF Q id,air,NFDH Q C
C r,D7 ¼ + + (10.41)
COP F COP NFDH COP C
+ C r,comp,DF + C r,id, fan,DF + C ASHP + C f ,V + C i,V ,
Q id,air,F + Q id,air,DF Q id,air,NFDH Q C
C r,D8 ¼ + +
COP F COP NFDH COP C (10.42)
+ C r,comp,DF + C r,id, fan,DF + C ASHP + C f ,T + C i,T + C f,V + C i,V
10.3.2 Results and Discussions
All the calculation results are shown in Figs. 10.19–10.29. Among them, the running
costs of the four typical cases are presented in Figs. 10.19–10.23, and the total costs
shown in Figs. 10.24–10.26. The proportions of the initial cost and additional initial
cost in the total cost are shown in Figs. 10.27 and 10.28. Variations of the electricity
unit price are discussed and presented in Fig. 10.29.
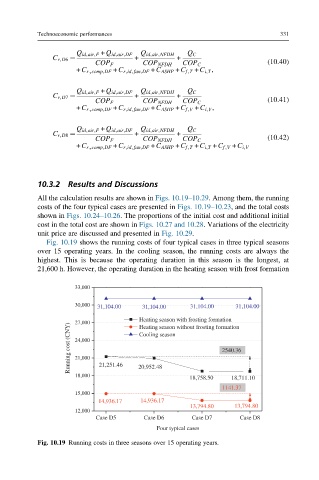
Fig. 10.19 shows the running costs of four typical cases in three typical seasons
over 15 operating years. In the cooling season, the running costs are always the
highest. This is because the operating duration in this season is the longest, at
21,600 h. However, the operating duration in the heating season with frost formation
33,000
30,000 31,104.00 31,104.00 31,104.00 31,104.00
Heating season with frosting formation
27,000
)
Y Heating season without frosting formation
N
C Cooling season
( 24,000
t
s
o
c 2540.36
g
n 21,000
i
n
n 21,251.46
u 20,952.48
R
18,000
18,758.50 18,711.10
1141.37
15,000
14,936.17 14,936.17
13,794.80 13,794.80
12,000
Case D5 Case D6 Case D7 Case D8
Four typical cases
Fig. 10.19 Running costs in three seasons over 15 operating years.