
Page 332 - Defrosting for Air Source Heat Pump
P. 332
Technoeconomic performances 327
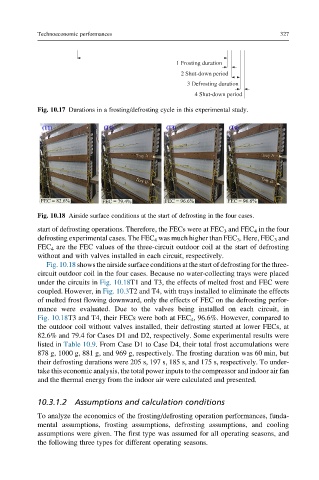
1 Frosting duration
2 Shut-down period
3 Defrosting duration
4 Shut-down period
Fig. 10.17 Durations in a frosting/defrosting cycle in this experimental study.
Fig. 10.18 Airside surface conditions at the start of defrosting in the four cases.
start of defrosting operations. Therefore, the FECs were at FEC 3 and FEC 4 in the four
defrosting experimental cases. The FEC 4 was much higher than FEC 3 . Here, FEC 3 and
FEC 4 are the FEC values of the three-circuit outdoor coil at the start of defrosting
without and with valves installed in each circuit, respectively.
Fig. 10.18 shows the airside surface conditions at the start of defrosting for the three-
circuit outdoor coil in the four cases. Because no water-collecting trays were placed
under the circuits in Fig. 10.18T1 and T3, the effects of melted frost and FEC were
coupled. However, in Fig. 10.3T2 and T4, with trays installed to eliminate the effects
of melted frost flowing downward, only the effects of FEC on the defrosting perfor-
mance were evaluated. Due to the valves being installed on each circuit, in
Fig. 10.18T3 and T4, their FECs were both at FEC 4 , 96.6%. However, compared to
the outdoor coil without valves installed, their defrosting started at lower FECs, at
82.6% and 79.4 for Cases D1 and D2, respectively. Some experimental results were
listed in Table 10.9. From Case D1 to Case D4, their total frost accumulations were
878 g, 1000 g, 881 g, and 969 g, respectively. The frosting duration was 60 min, but
their defrosting durations were 205 s, 197 s, 185 s, and 175 s, respectively. To under-
take this economic analysis, the total power inputs to the compressor and indoor air fan
and the thermal energy from the indoor air were calculated and presented.
10.3.1.2 Assumptions and calculation conditions
To analyze the economics of the frosting/defrosting operation performances, funda-
mental assumptions, frosting assumptions, defrosting assumptions, and cooling
assumptions were given. The first type was assumed for all operating seasons, and
the following three types for different operating seasons.