
Page 334 - Defrosting for Air Source Heat Pump
P. 334
Technoeconomic performances 329
ii. In heating season with frost formation, cycle operation was assumed to be 15 times/day. In
heating season without frost formation, the duration of the frosting operation was assumed
to be 12 h/day.
iii. When an ASHP unit works at the heating season with frost formation, the system frosting
COP was assumed at the average value of COP in 60 min, as listed in Item 3 in Table 10.2
(When it reached 60 min, the COP decreased dramatically).
iv. When the ASHP unit works at the heating season without frost formation, the system COP
was assumed at the average value of COP in the first 10 min, as listed in Item 4 in
Table 10.2.
v. The COP showed a good linear relationship with the FEC, allowing the values of the COP
at different FECs to be calculated.
vi. The total indoor heat supplied showed a good linear relationship with the FEC. The values
of the indoor heat supplied at different FECs could be calculated.
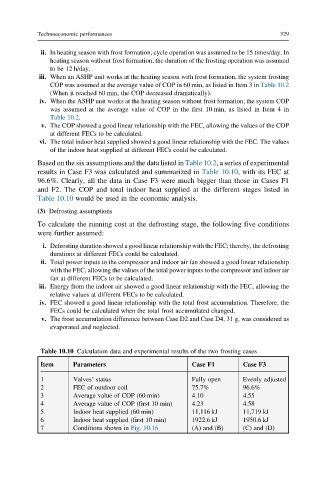
Based on the six assumptions and the data listed in Table 10.2, a series of experimental
results in Case F3 was calculated and summarized in Table 10.10, with its FEC at
96.6%. Clearly, all the data in Case F3 were much bigger than those in Cases F1
and F2. The COP and total indoor heat supplied at the different stages listed in
Table 10.10 would be used in the economic analysis.
(3) Defrosting assumptions
To calculate the running cost at the defrosting stage, the following five conditions
were further assumed:
i. Defrosting duration showed a good linear relationship with the FEC; thereby, the defrosting
durations at different FECs could be calculated.
ii. Total power inputs to the compressor and indoor air fan showed a good linear relationship
with the FEC, allowing the values of the total power inputs to the compressor and indoor air
fan at different FECs to be calculated.
iii. Energy from the indoor air showed a good linear relationship with the FEC, allowing the
relative values at different FECs to be calculated.
iv. FEC showed a good linear relationship with the total frost accumulation. Therefore, the
FECs could be calculated when the total frost accumulated changed.
v. The frost accumulation difference between Case D2 and Case D4, 31 g, was considered as
evaporated and neglected.
Table 10.10 Calculation data and experimental results of the two frosting cases
Item Parameters Case F1 Case F3
1 Valves’ status Fully open Evenly adjusted
2 FEC of outdoor coil 75.7% 96.6%
3 Average value of COP (60 min) 4.10 4.55
4 Average value of COP (first 10 min) 4.23 4.58
5 Indoor heat supplied (60 min) 11,116 kJ 11,719 kJ
6 Indoor heat supplied (first 10 min) 1922.6 kJ 1950.6 kJ
7 Conditions shown in Fig. 10.16 (A) and (B) (C) and (D)