
Page 62 - Defrosting for Air Source Heat Pump
P. 62
Uneven defrosting on the outdoor coil in an ASHP 53
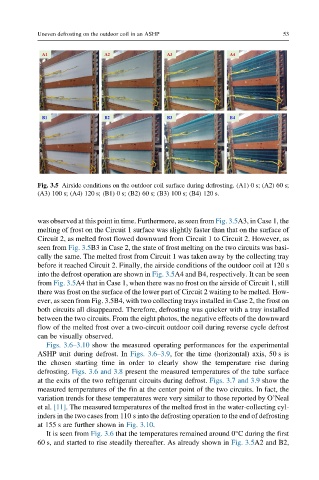
Fig. 3.5 Airside conditions on the outdoor coil surface during defrosting. (A1) 0 s; (A2) 60 s;
(A3) 100 s; (A4) 120 s; (B1) 0 s; (B2) 60 s; (B3) 100 s; (B4) 120 s.
was observed at this point in time. Furthermore, as seen from Fig. 3.5A3, in Case 1, the
melting of frost on the Circuit 1 surface was slightly faster than that on the surface of
Circuit 2, as melted frost flowed downward from Circuit 1 to Circuit 2. However, as
seen from Fig. 3.5B3 in Case 2, the state of frost melting on the two circuits was basi-
cally the same. The melted frost from Circuit 1 was taken away by the collecting tray
before it reached Circuit 2. Finally, the airside conditions of the outdoor coil at 120 s
into the defrost operation are shown in Fig. 3.5A4 and B4, respectively. It can be seen
from Fig. 3.5A4 that in Case 1, when there was no frost on the airside of Circuit 1, still
there was frost on the surface of the lower part of Circuit 2 waiting to be melted. How-
ever, as seen from Fig. 3.5B4, with two collecting trays installed in Case 2, the frost on
both circuits all disappeared. Therefore, defrosting was quicker with a tray installed
between the two circuits. From the eight photos, the negative effects of the downward
flow of the melted frost over a two-circuit outdoor coil during reverse cycle defrost
can be visually observed.
Figs. 3.6–3.10 show the measured operating performances for the experimental
ASHP unit during defrost. In Figs. 3.6–3.9, for the time (horizontal) axis, 50 s is
the chosen starting time in order to clearly show the temperature rise during
defrosting. Figs. 3.6 and 3.8 present the measured temperatures of the tube surface
at the exits of the two refrigerant circuits during defrost. Figs. 3.7 and 3.9 show the
measured temperatures of the fin at the center point of the two circuits. In fact, the
variation trends for these temperatures were very similar to those reported by O’Neal
et al. [11]. The measured temperatures of the melted frost in the water-collecting cyl-
inders in the two cases from 110 s into the defrosting operation to the end of defrosting
at 155 s are further shown in Fig. 3.10.
It is seen from Fig. 3.6 that the temperatures remained around 0°C during the first
60 s, and started to rise steadily thereafter. As already shown in Fig. 3.5A2 and B2,