
Page 69 - Defrosting for Air Source Heat Pump
P. 69
60 Defrosting for Air Source Heat Pump
Table 3.5 Continued
Measurement/
Item Parameter calculation error Unit
8 Refrigerant volumetric flow rate 1.6% (variable area –
flow meter)
9 Mass of melted frost collected 0.1 (weighing scale) g
10 Mass of residual water collected 0.1 (weighing scale) g
11 Temperature of melted frost collected 1 (K-type °C
thermocouple)
12 Total energy supply for defrosting 1% (calculated) kJ
13 Total energy consumption during 1% (calculated) kJ
defrosting
14 Defrosting efficiency 0.15% (calculated) –
3.3.2 Experimental cases
To study the effects of the downward flowing of the melted frost over the three-circuit
outdoor coil surface due to gravity on defrosting performance, a series of experimental
works using the experimental ASHP unit have been carried out. In order to obtain
meaningful experimental results, it was necessary to ensure that the frost that accu-
mulated on the surface of the three circuits was even first. Therefore, a series of
trial-and-error manual adjustments of the degree of opening of the stop valves, to
adjust the refrigerant flow into each circuit so that a set of fixed degree of valve open-
ings was obtained, such that the amount of frost accumulation on the three circuits was
close to each other (difference < 10%). Experimental work was then carried out at
three experimental cases, as detailed in Table 3.6, so that the effects of the downward
flowing of melted frost on the defrosting performance can be comparatively and
quantitatively analyzed.
3.3.3 Results and analysis
Fig. 3.12 presents 12 photographs showing the defrosting process on the airside of the
three circuits of the experimental outdoor coil, with photos (A1)–(A4) for Case 1,
photos (B1)–(B4) for Case 2, and photos (C1)–(C4) for Case 3, respectively.
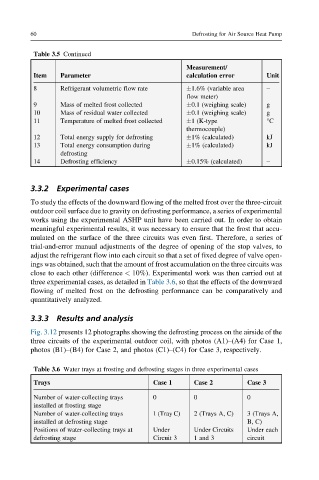
Table 3.6 Water trays at frosting and defrosting stages in three experimental cases
Trays Case 1 Case 2 Case 3
Number of water-collecting trays 0 0 0
installed at frosting stage
Number of water-collecting trays 1 (Tray C) 2 (Trays A, C) 3 (Trays A,
installed at defrosting stage B, C)
Positions of water-collecting trays at Under Under Circuits Under each
defrosting stage Circuit 3 1 and 3 circuit