
Page 71 - Defrosting for Air Source Heat Pump
P. 71
62 Defrosting for Air Source Heat Pump
of frost melting on the two up-circuits was basically the same. The melted frost from
Circuit 1 was taken away by the collecting tray before it reached Circuit 2. Finally, the
airside conditions of the outdoor coil at 150 s into the defrosting operation at the three
experimental cases are shown in Fig. 3.12A4, B4, and C4, respectively. It can be seen
from Fig. 3.12A4 that with only one tray, while the airside of Circuit 1 was already
free of frost, there was still frost on the surface of the lower part of Circuit 2 and
Circuit 3 waiting to be melted. Also as seen from Fig. 3.12B4 with two collecting
trays installed under Circuit 1 and Circuit 3, there was nearly no frost left on the
two up-circuits while clearly there was some frost left on Circuit 3. However, as seen
from Fig. 3.12C4, with three collecting trays installed, the frost on the three circuits all
disappeared. Therefore, defrosting was quicker and more even with trays installed.
From the above 12 photos, the negative effects of the downward flowing of melted
frost over the experimental three-circuit vertical outdoor coil due to gravity on the
defrosting performance during RCD can be visually observed.
The measured operating performances of the experimental ASHP unit during
defrosting, corresponding to the three experimental cases, are presented in
Figs. 3.13–3.18. In all these figures, for their time (horizontal) axis, 80 s is the chosen
starting time in order to clearly show the temperature rise during defrosting.
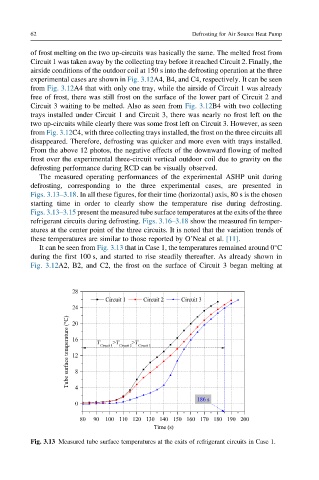
Figs. 3.13–3.15 present the measured tube surface temperatures at the exits of the three
refrigerant circuits during defrosting. Figs. 3.16–3.18 show the measured fin temper-
atures at the center point of the three circuits. It is noted that the variation trends of
these temperatures are similar to those reported by O’Neal et al. [11].
It can be seen from Fig. 3.13 that in Case 1, the temperatures remained around 0°C
during the first 100 s, and started to rise steadily thereafter. As already shown in
Fig. 3.12A2, B2, and C2, the frost on the surface of Circuit 3 began melting at
Fig. 3.13 Measured tube surface temperatures at the exits of refrigerant circuits in Case 1.