Page 403 - Design and Operation of Heat Exchangers and their Networks
P. 403

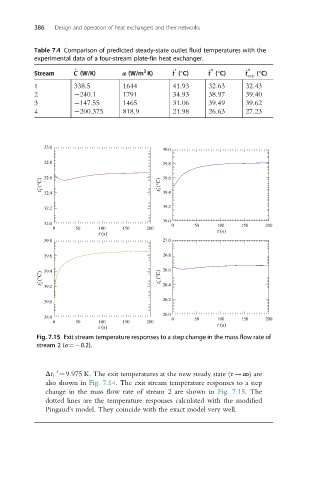
386   Design and operation of heat exchangers and their networks


          Table 7.4 Comparison of predicted steady-state outlet fluid temperatures with the
          experimental data of a four-stream plate-fin heat exchanger.

                                        2
                                                          00
                                                0
                     C (W/K)
          Stream     ^ _          α (W/m K)    ^ t (°C)  ^ t (°C)  ^ t  00 exp  (°C)
          1          338.5        1644          41.93    32.63     32.43
          2           240.1       1791          34.93    38.97     39.40
          3           147.55      1465          31.06    39.49     39.62
          4           200.375     818.9         21.98    26.63     27.23


             33.0                            40.0

             32.8                            39.8

             32.6                            39.6
            t 1 ² (°C)                      t 3 ² (°C)
             32.4                            39.4

             32.2                            39.2
                                             39.0
             32.0                              0      50    100   150    200
               0     50     100   150    200                 (s)
                            (s)
             39.8                            27.0
             39.6                            26.8

            t 2 ² (°C)  39.4                t 4 ² (°C)  26.6
             39.2                            26.4
                                             26.2
             39.0
                                             26.0
             38.8                              0      50    100   150    200
               0     50     100   150    200
                            (s)                              (s)
           Fig. 7.15 Exit stream temperature responses to a step change in the mass flow rate of
           stream 2 (σ ¼ 0.2).


             Δt 1 ¼9.975 K. The exit temperatures at the new steady state (τ!∞) are
                0
             also shown in Fig. 7.14. The exit stream temperature responses to a step
             change in the mass flow rate of stream 2 are shown in Fig. 7.15. The
             dotted lines are the temperature responses calculated with the modified
             Pingaud’s model. They coincide with the exact model very well.
   398   399   400   401   402   403   404   405   406   407   408