
Page 194 - Design for Environment A Guide to Sustainable Product Development
P. 194
Analysis Methods for Design Decisions 173
Footprint Indicators
The term “footprint” has become popular in the environmental lexi-
con, but it is used so loosely as to be virtually meaningless. Most
practitioners conceive of the environmental footprint of a company,
a household, or a community as being an aggregate measure of the
total burden that it places on the environment. However, some have
interpreted this in terms of a single metric, such as a “carbon foot-
print” while others have interpreted it as a collection of indicators
representing different environmental burdens (e.g., energy use, solid
waste, air emissions). In the latter case, plotting these indicators on
a “radar chart” enables a company to track its progress over time as
the footprint shrinks toward zero.
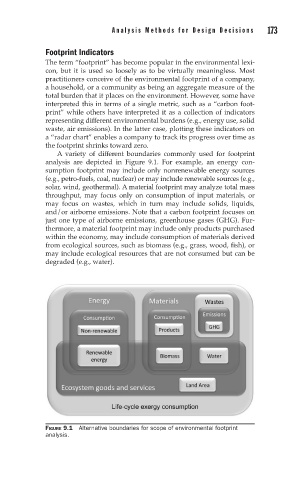
A variety of different boundaries commonly used for footprint
analysis are depicted in Figure 9.1. For example, an energy con-
sumption footprint may include only nonrenewable energy sources
(e.g., petro-fuels, coal, nuclear) or may include renewable sources (e.g.,
solar, wind, geothermal). A material footprint may analyze total mass
throughput, may focus only on consumption of input materials, or
may focus on wastes, which in turn may include solids, liquids,
and/or airborne emissions. Note that a carbon footprint focuses on
just one type of airborne emissions, greenhouse gases (GHG). Fur-
thermore, a material footprint may include only products purchased
within the economy, may include consumption of materials derived
from ecological sources, such as biomass (e.g., grass, wood, fish), or
may include ecological resources that are not consumed but can be
degraded (e.g., water).
FIGURE 9.1 Alternative boundaries for scope of environmental footprint
analysis.