
Page 247 - Design for Six Sigma a Roadmap for Product Development
P. 247
Quality Function Deployment (QFD) 217
B E C
A
Customer
Customer Rest of
+ QFD Perceived
Needs DFSS
– Result
D
Customer
Satisfaction
Gauge
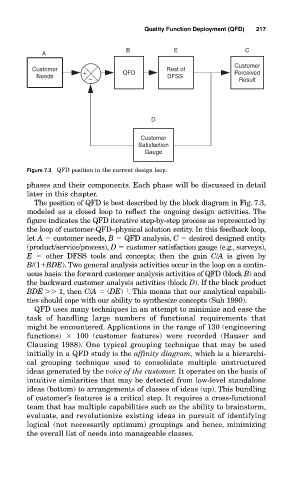
Figure 7.3 QFD position in the current design loop.
phases and their components. Each phase will be discussed in detail
later in this chapter.
The position of QFD is best described by the block diagram in Fig. 7.3,
modeled as a closed loop to reflect the ongoing design activities. The
figure indicates the QFD iterative step-by-step process as represented by
the loop of customer-QFD–physical solution entity. In this feedback loop,
let A customer needs, B QFD analysis, C desired designed entity
(product/service/process), D customer satisfaction gauge (e.g., surveys),
E other DFSS tools and concepts; then the gain C/A is given by
B/(1 BDE). Two general analysis activities occur in the loop on a contin-
uous basis: the forward customer analysis activities of QFD (block B) and
the backward customer analysis activities (block D). If the block product
1
BDE 1, then C/A (DE) . This means that our analytical capabili-
ties should cope with our ability to synthesize concepts (Suh 1990).
QFD uses many techniques in an attempt to minimize and ease the
task of handling large numbers of functional requirements that
might be encountered. Applications in the range of 130 (engineering
functions)
100 (customer features) were recorded (Hauser and
Clausing 1988). One typical grouping technique that may be used
initially in a QFD study is the affinity diagram, which is a hierarchi-
cal grouping technique used to consolidate multiple unstructured
ideas generated by the voice of the customer. It operates on the basis of
intuitive similarities that may be detected from low-level standalone
ideas (bottom) to arrangements of classes of ideas (up). This bundling
of customer’s features is a critical step. It requires a cross-functional
team that has multiple capabilities such as the ability to brainstorm,
evaluate, and revolutionize existing ideas in pursuit of identifying
logical (not necessarily optimum) groupings and hence, minimizing
the overall list of needs into manageable classes.