
Page 250 - Design for Six Sigma a Roadmap for Product Development
P. 250
220 Chapter Seven
7.4.3 Relationship matrix
The process of relating “WHATs” to “HOWs” often becomes complicated
by the absence of one-to-one relationships as some of the HOWs affect
more than one WHAT. In many cases, they adversely affect one another.
HOWs that could have an adverse effect on another customer want are
important. For example, “cool” and “stylish” are two of the WHATs that
a customer would want in a vehicle. The HOWs that support “cool”
include lower noise, roominess, and seat design requirements. These
HOWs will also have some effect on the “stylish” requirement as well.
A relationship is created in the house of quality (HOQ) between the
HOWs as columns and the WHATs in the rows. The relationship in
every (WHAT, HOW) cell can be displayed by placing a symbol repre-
senting the cause-effect relationship strength in that cell. When
employees at the Kobe Shipyards developed this matrix in 1972, they
used the local horse racing symbols in their QFD as relationship matrix
symbols; for instance, the double-centered circle means strong rela-
tionship, one circle means medium strength, and a triangle indicates a
weak relationship. Symbols are used instead of direct numbers
because they can be identified and interpreted easily and quickly.
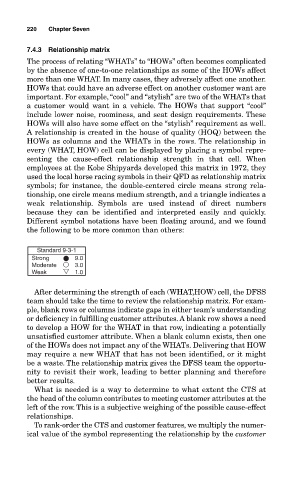
Different symbol notations have been floating around, and we found
the following to be more common than others:
Standard 9-3-1
Strong 9.0
Moderate 3.0
Weak 1.0
After determining the strength of each (WHAT,HOW) cell, the DFSS
team should take the time to review the relationship matrix. For exam-
ple, blank rows or columns indicate gaps in either team’s understanding
or deficiency in fulfilling customer attributes. A blank row shows a need
to develop a HOW for the WHAT in that row, indicating a potentially
unsatisfied customer attribute. When a blank column exists, then one
of the HOWs does not impact any of the WHATs. Delivering that HOW
may require a new WHAT that has not been identified, or it might
be a waste. The relationship matrix gives the DFSS team the opportu-
nity to revisit their work, leading to better planning and therefore
better results.
What is needed is a way to determine to what extent the CTS at
the head of the column contributes to meeting customer attributes at the
left of the row. This is a subjective weighing of the possible cause-effect
relationships.
To rank-order the CTS and customer features, we multiply the numer-
ical value of the symbol representing the relationship by the customer